fbpx

Sahara Groundwater

Check Groundwater Using Satellites  🛰️

Free Access

Check Groundwater Using Satellites

Google Earth Engine 🛰️⭐

Free Access

Analysis of graphs

Let’s See how you can analyse the graph

Book Now
, Analysis of Profile Map in PWQT Water Detector, Sahara Groundwater

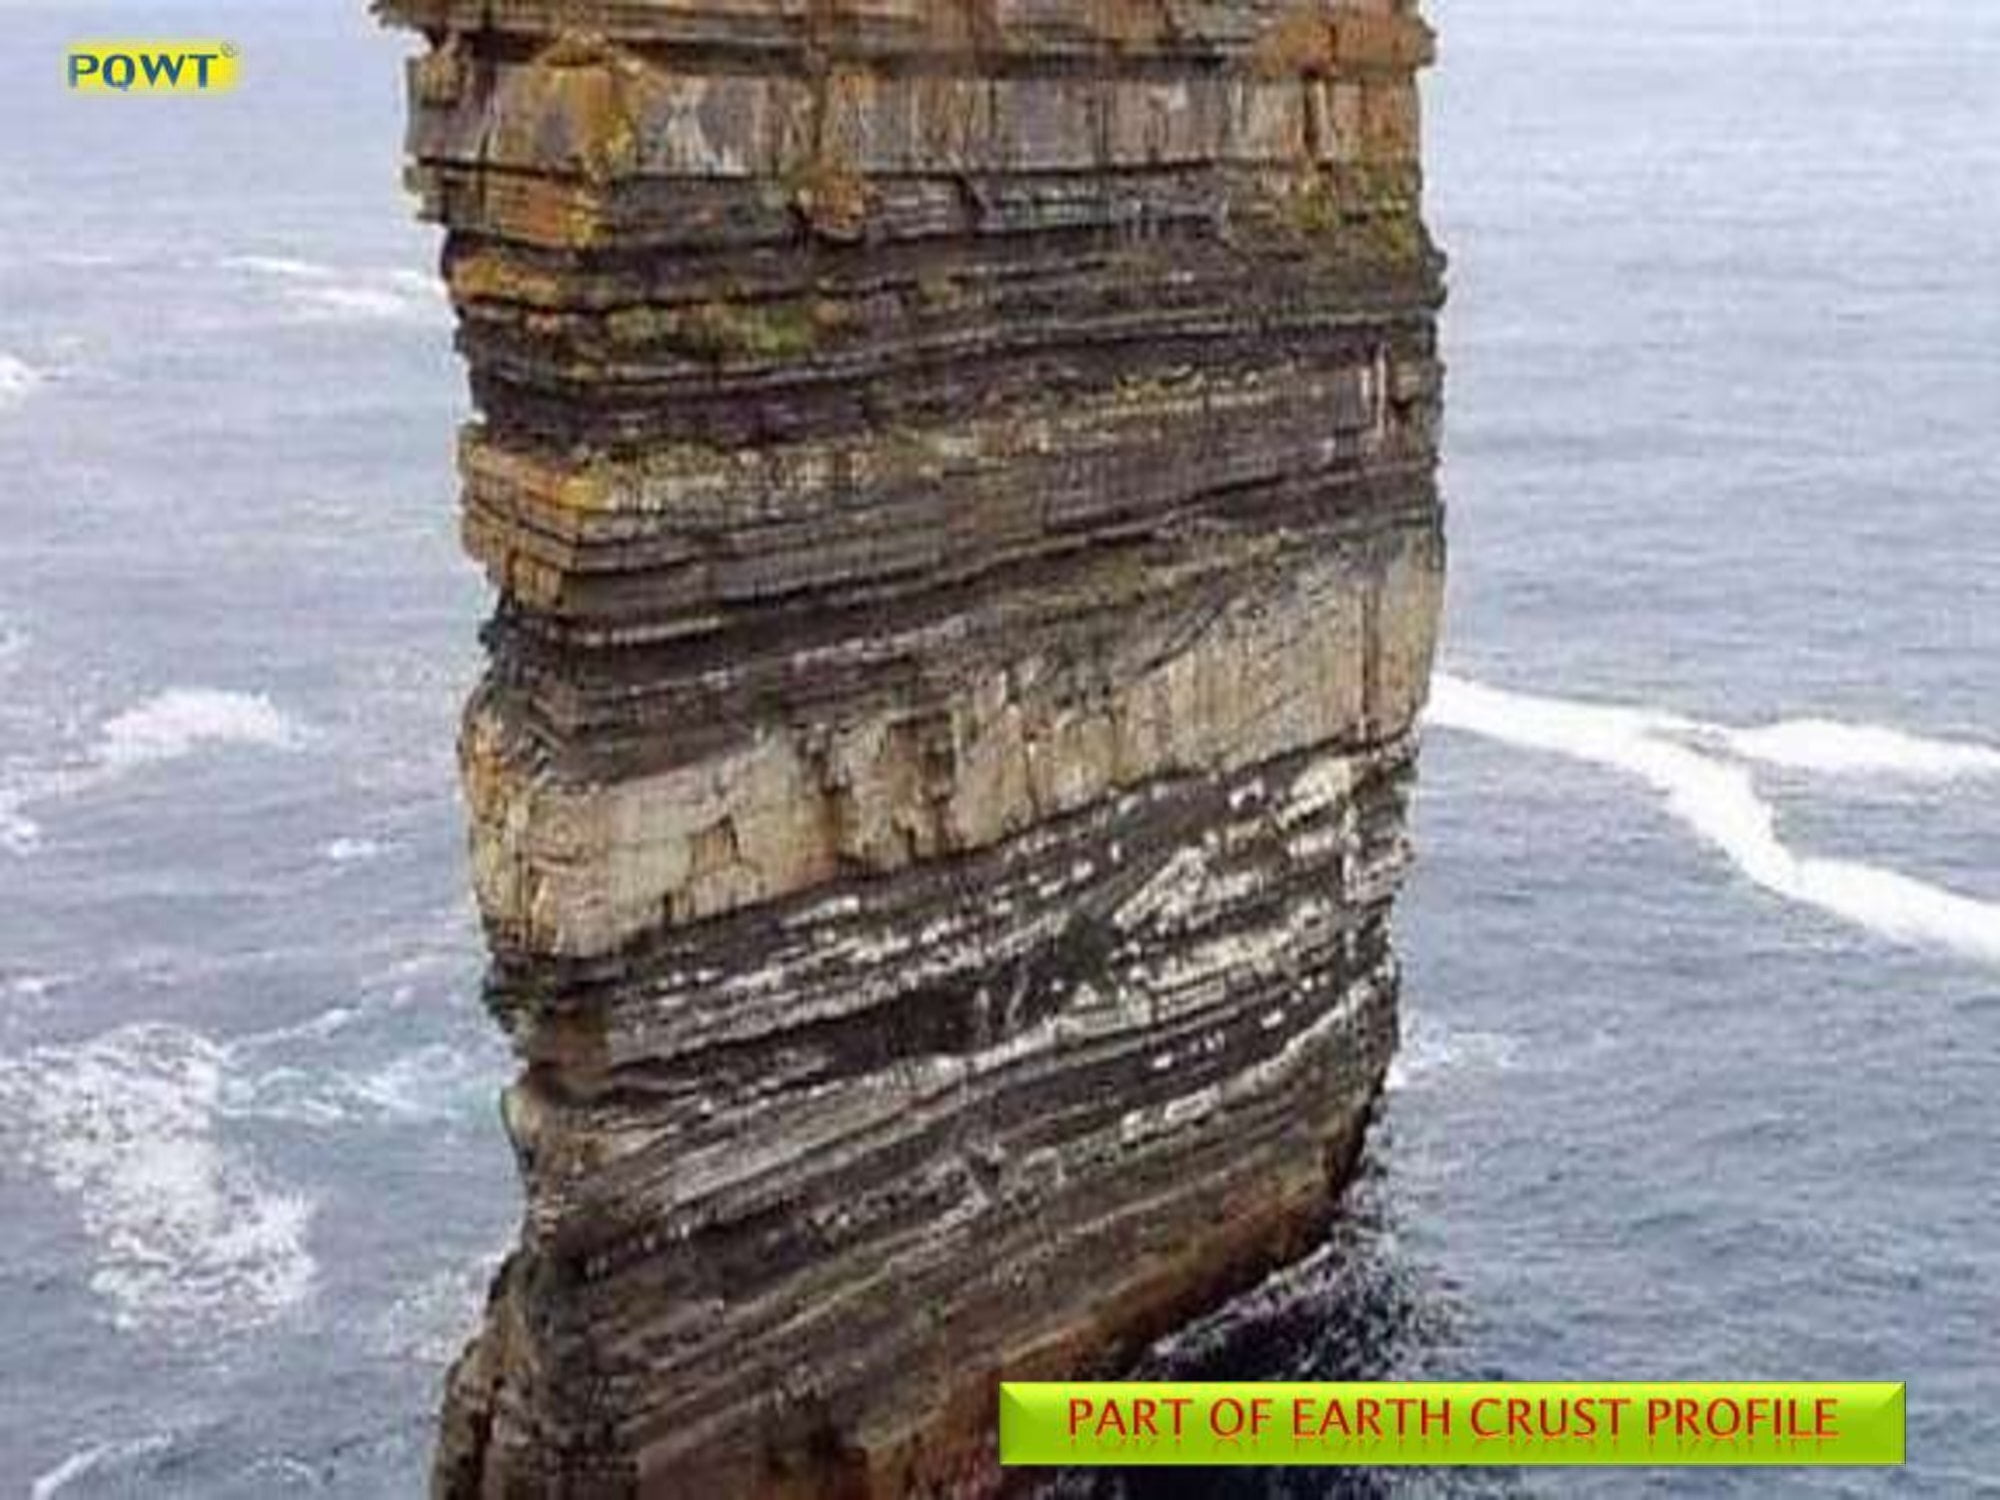
What is a Profile?

Profile means an outline of something like (object/materials/subsurface rock formations) as seen from one side

In other words we can say

Short description of the earth crust/ rocks and its formation stratigraphy / description / characteristic’s
, Analysis of Profile Map in PWQT Water Detector, Sahara Groundwater


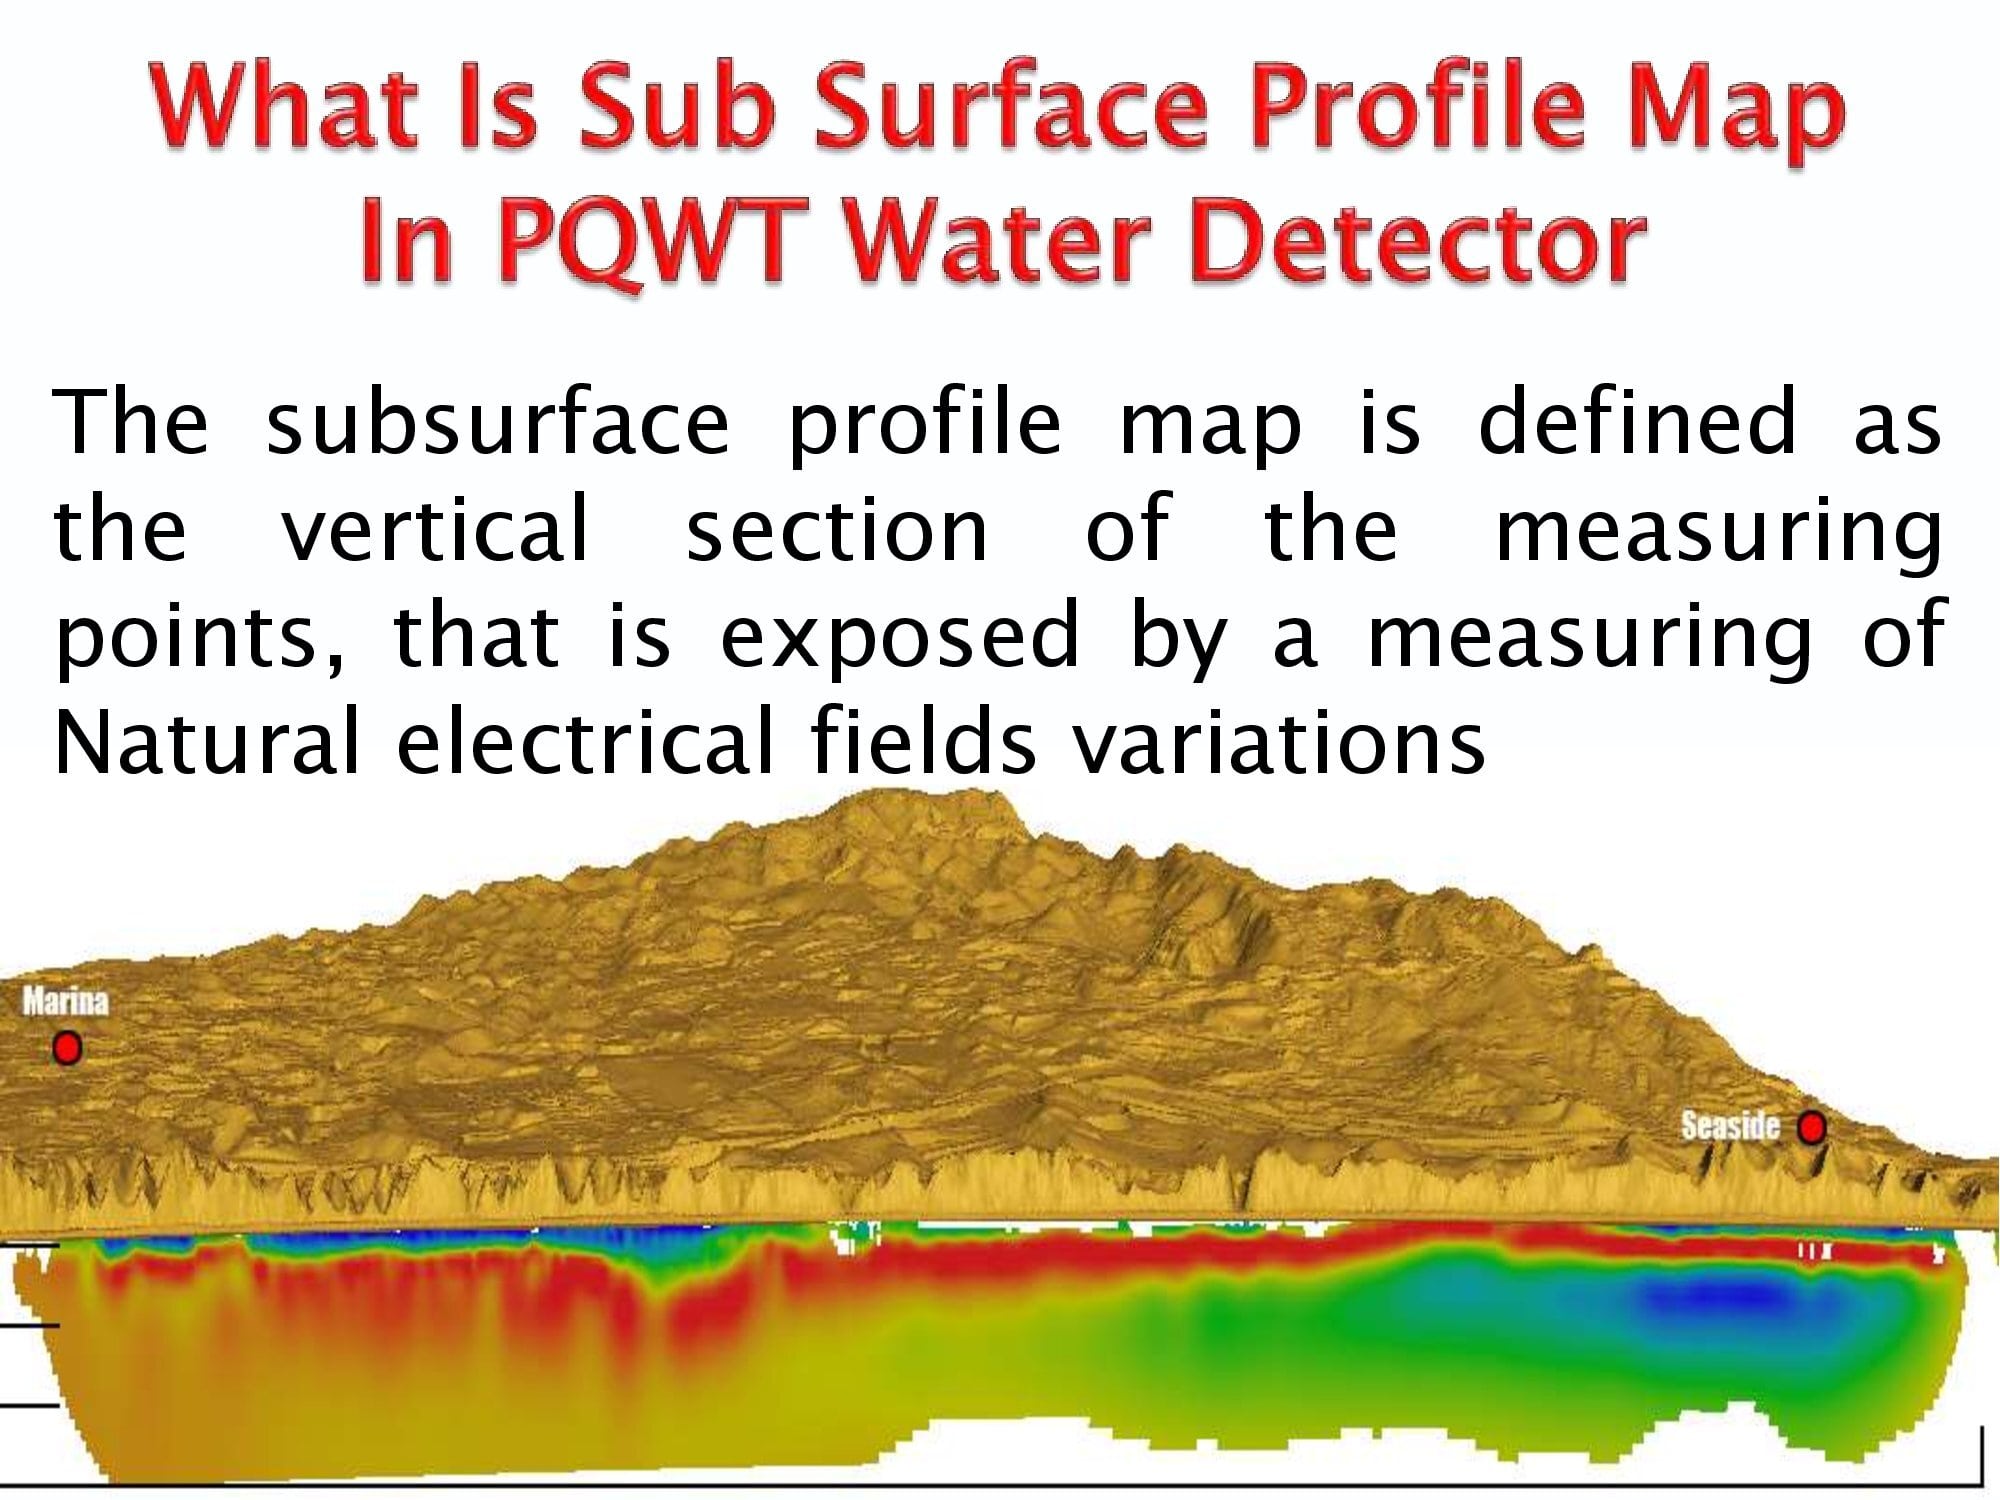
What Is Sub Surface Profile Map In PQWT Water Detector

The subsurface profile map is defined as the vertical section of the measuring points, that is exposed by a measuring of Natural electrical fields variations .

Subsurface profile map whose contours represent the elevation of a particular rock / mineral / ore formation, reservoir or geologic forms in beneath the surface, such that folds, faults, fractures and other geologic structures are clearly displayed .
, Analysis of Profile Map in PWQT Water Detector, Sahara Groundwater

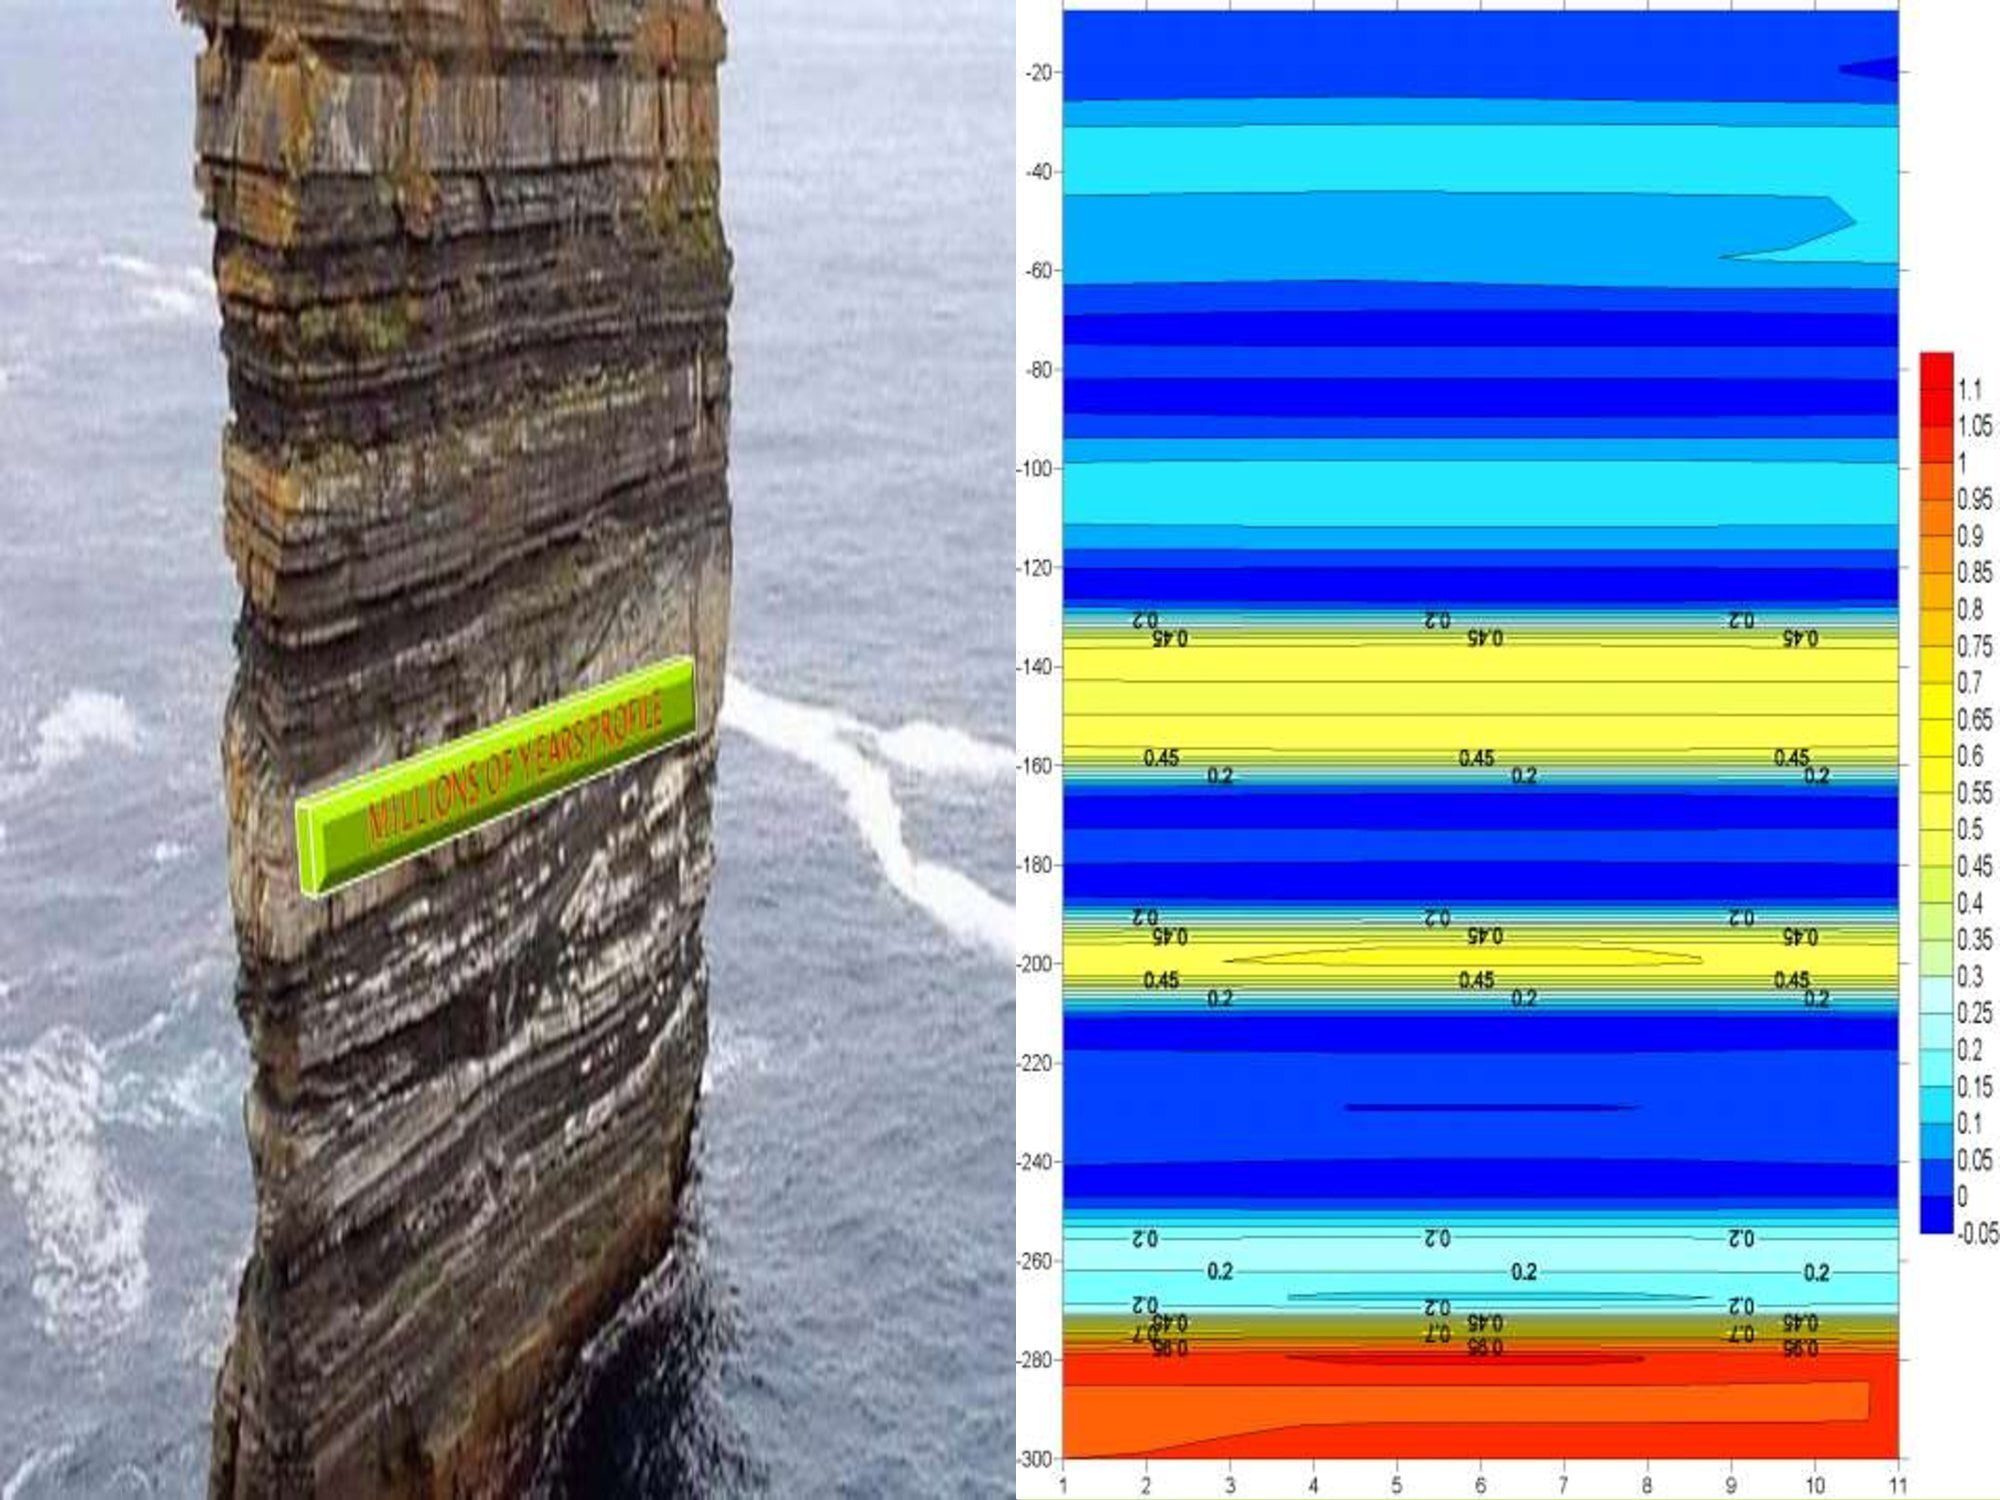
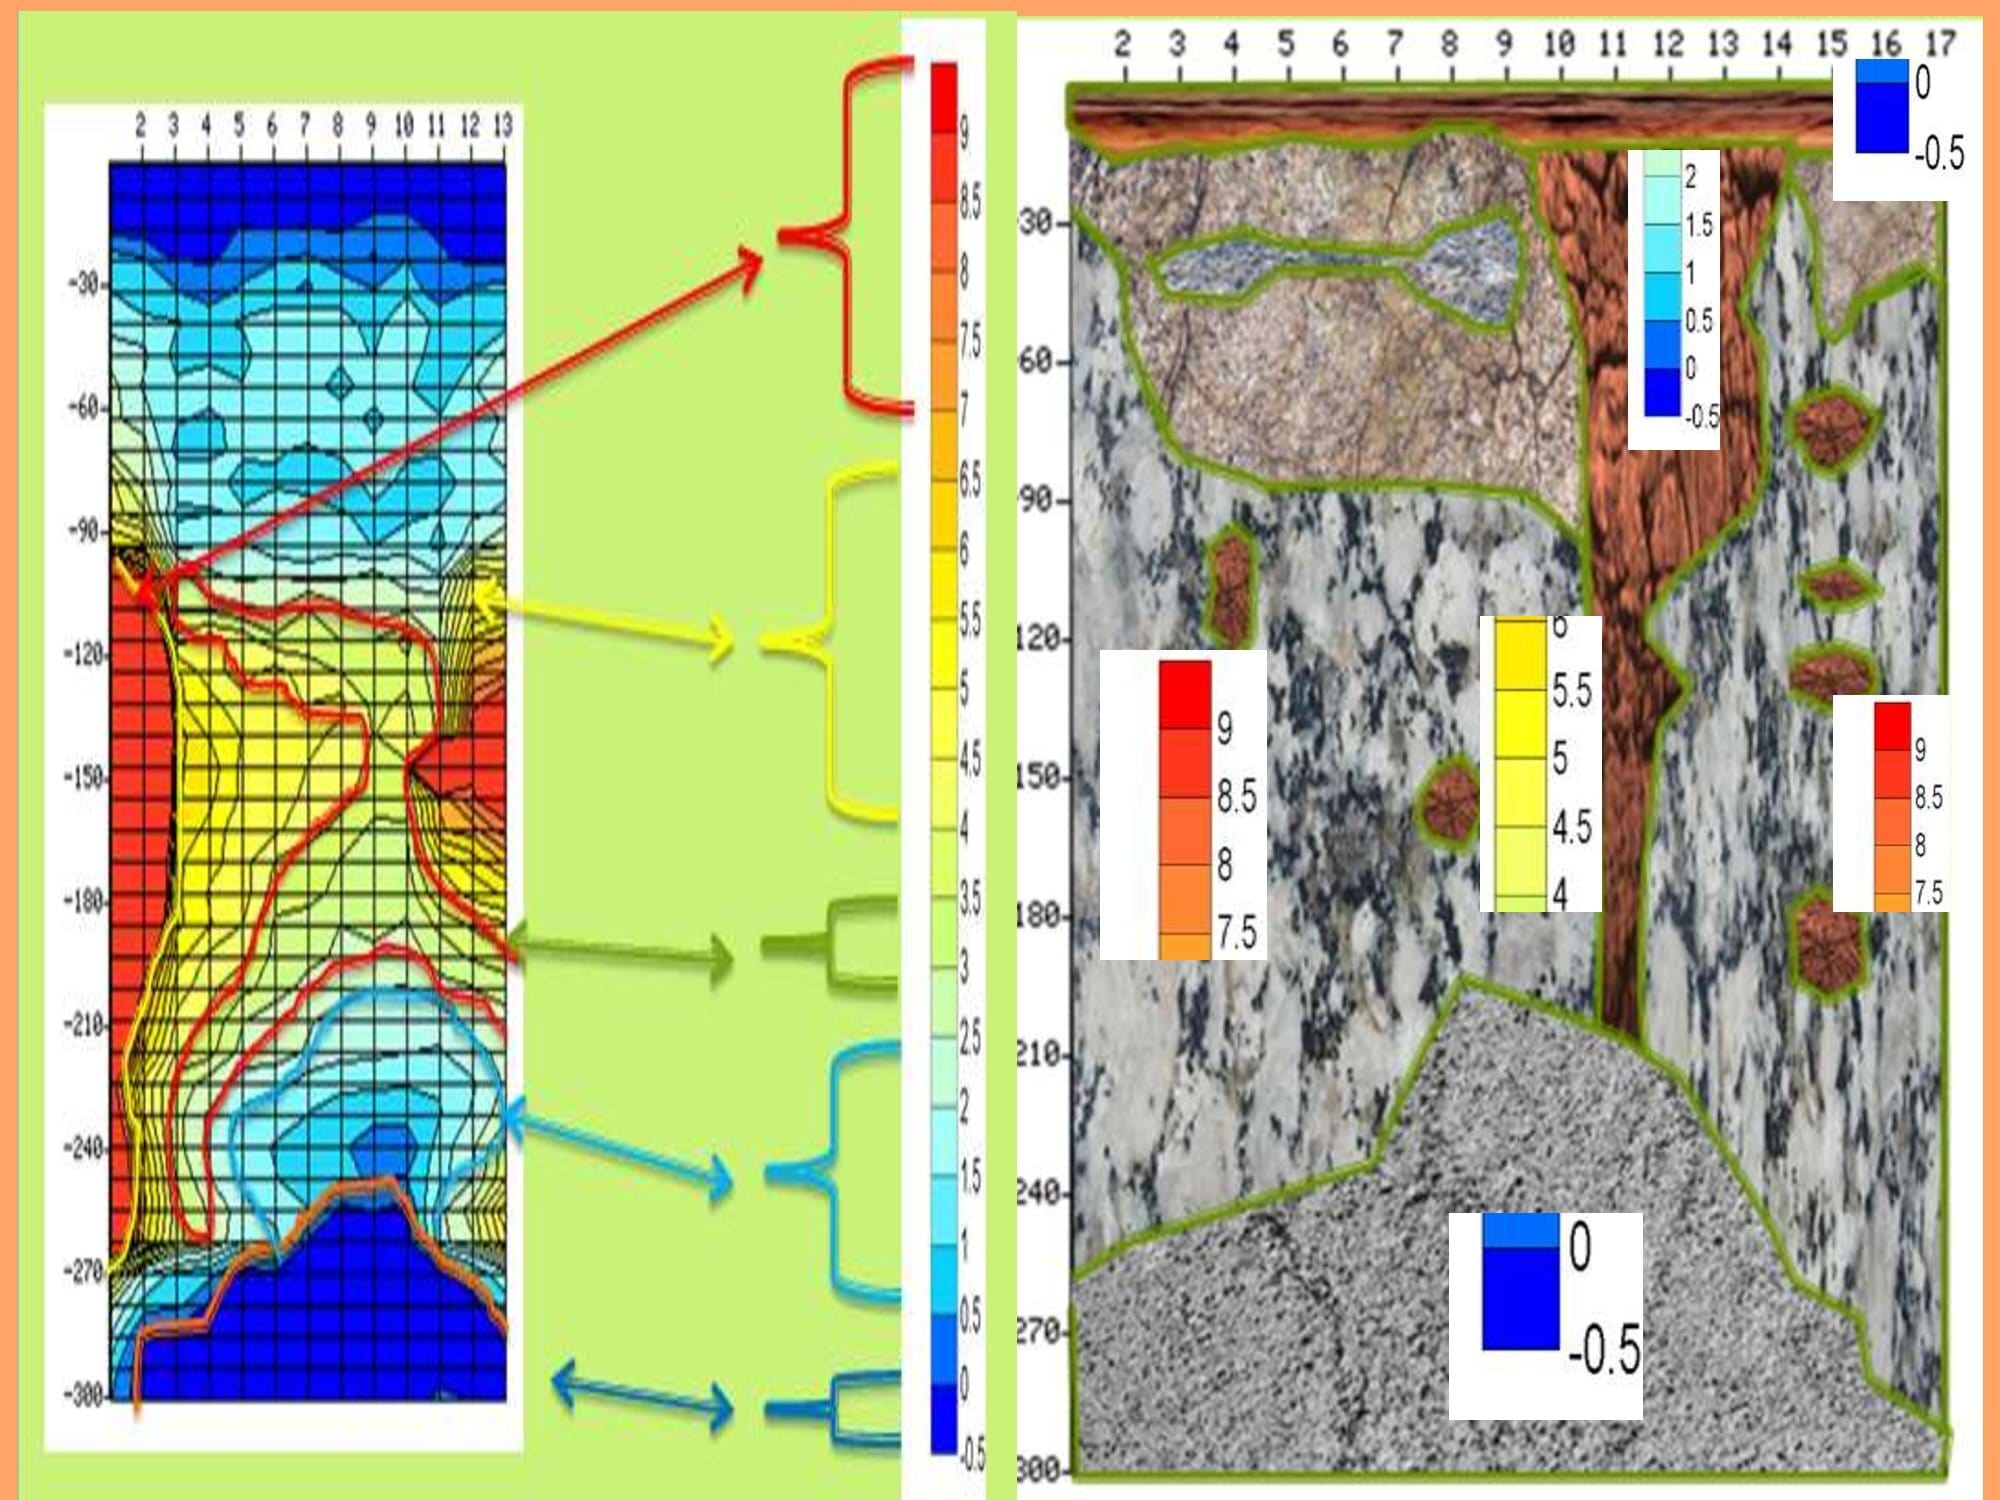
Profile Map and Reality

, Analysis of Profile Map in PWQT Water Detector, Sahara Groundwater

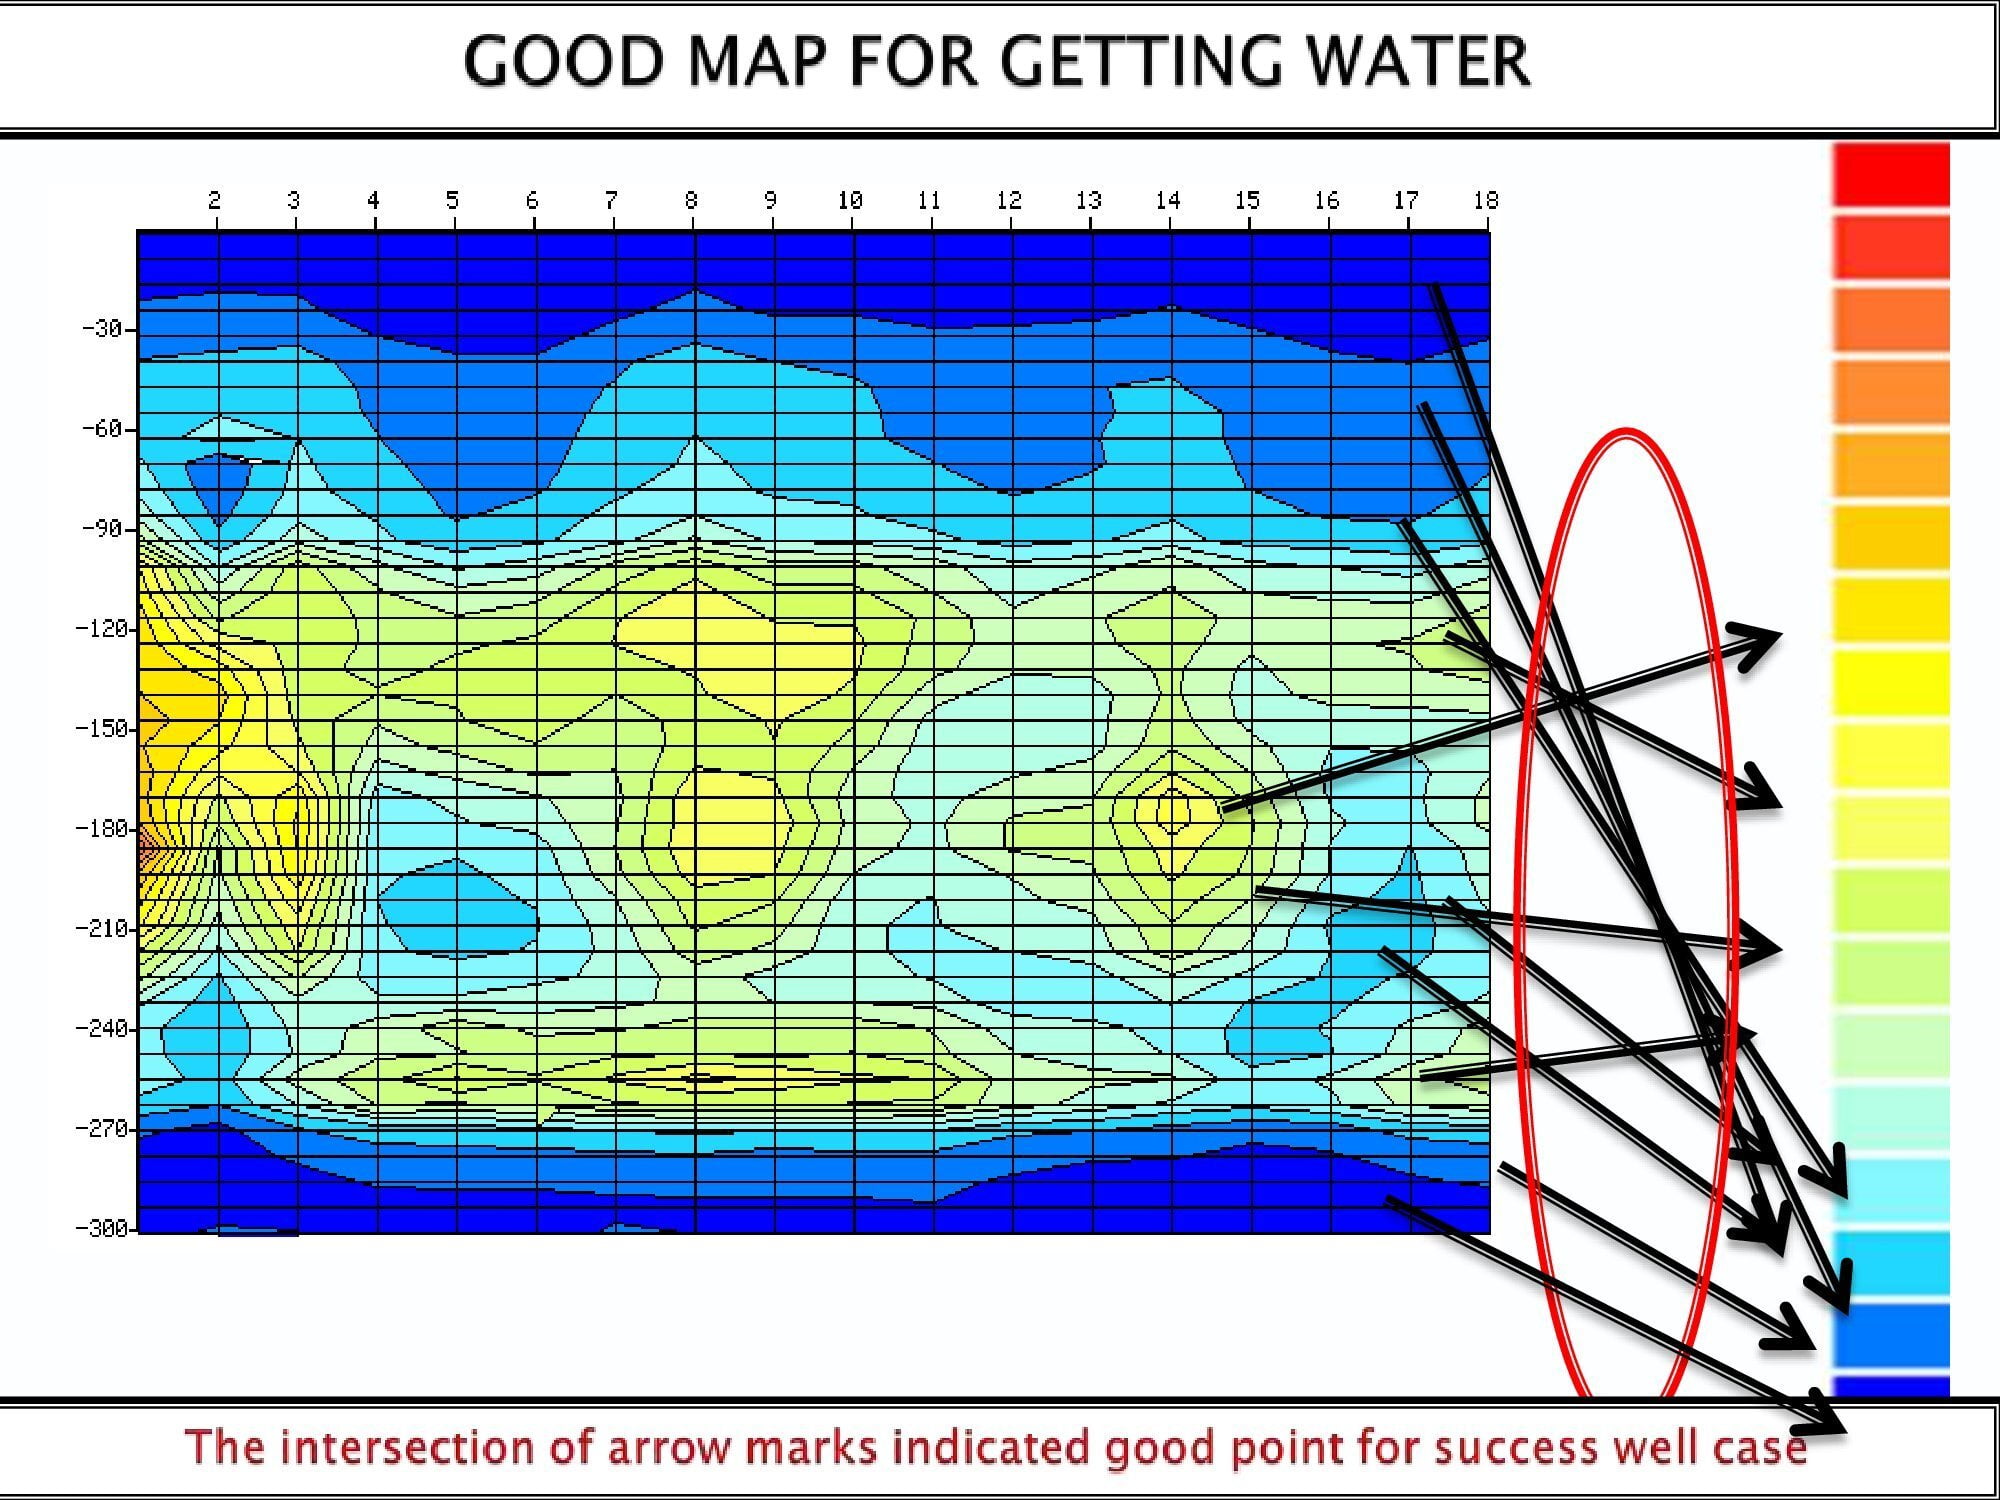
Profile Map Description                 

Parts of The Profile Map

Vertical Axis        :    Depth from Surface to Subsurface in meters

Horizontal Axis  :    Number of measured points in meters

Contour                 :    Values As per Local geological conditions in mille v

Color Chart          :    Red, Yellow, Blue and Mixed

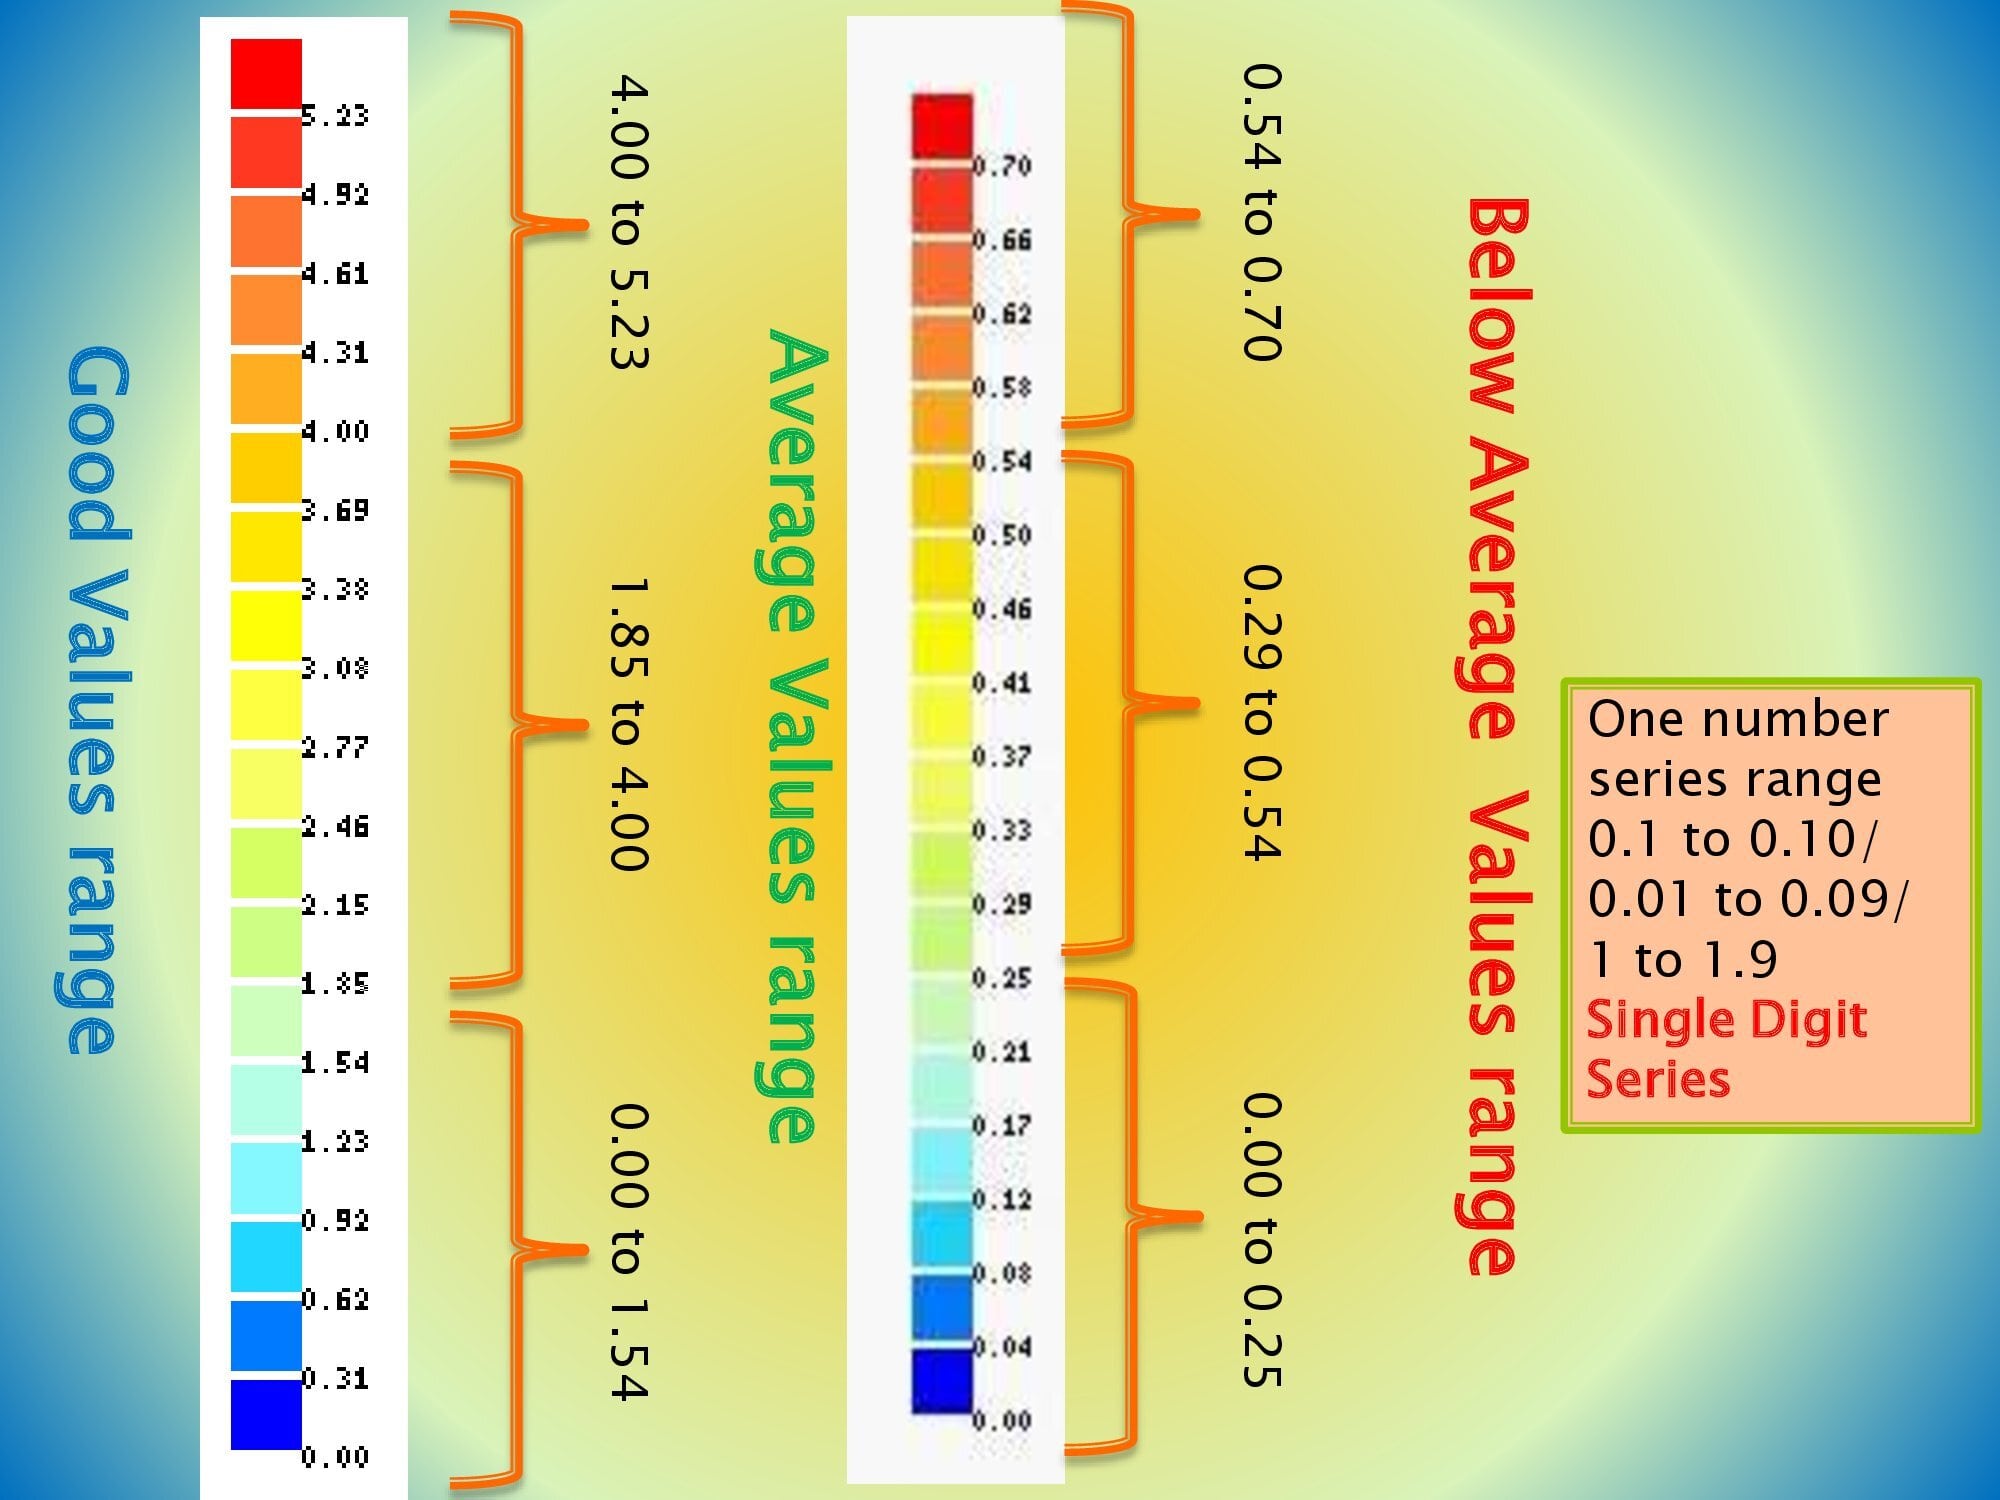
Values Range      :    Values as per the rock characteristics

Grid Lines              :    Vertical 4.5m/7.5/8.9 meters as per model / Horizontal 1 meter

, Analysis of Profile Map in PWQT Water Detector, Sahara Groundwater

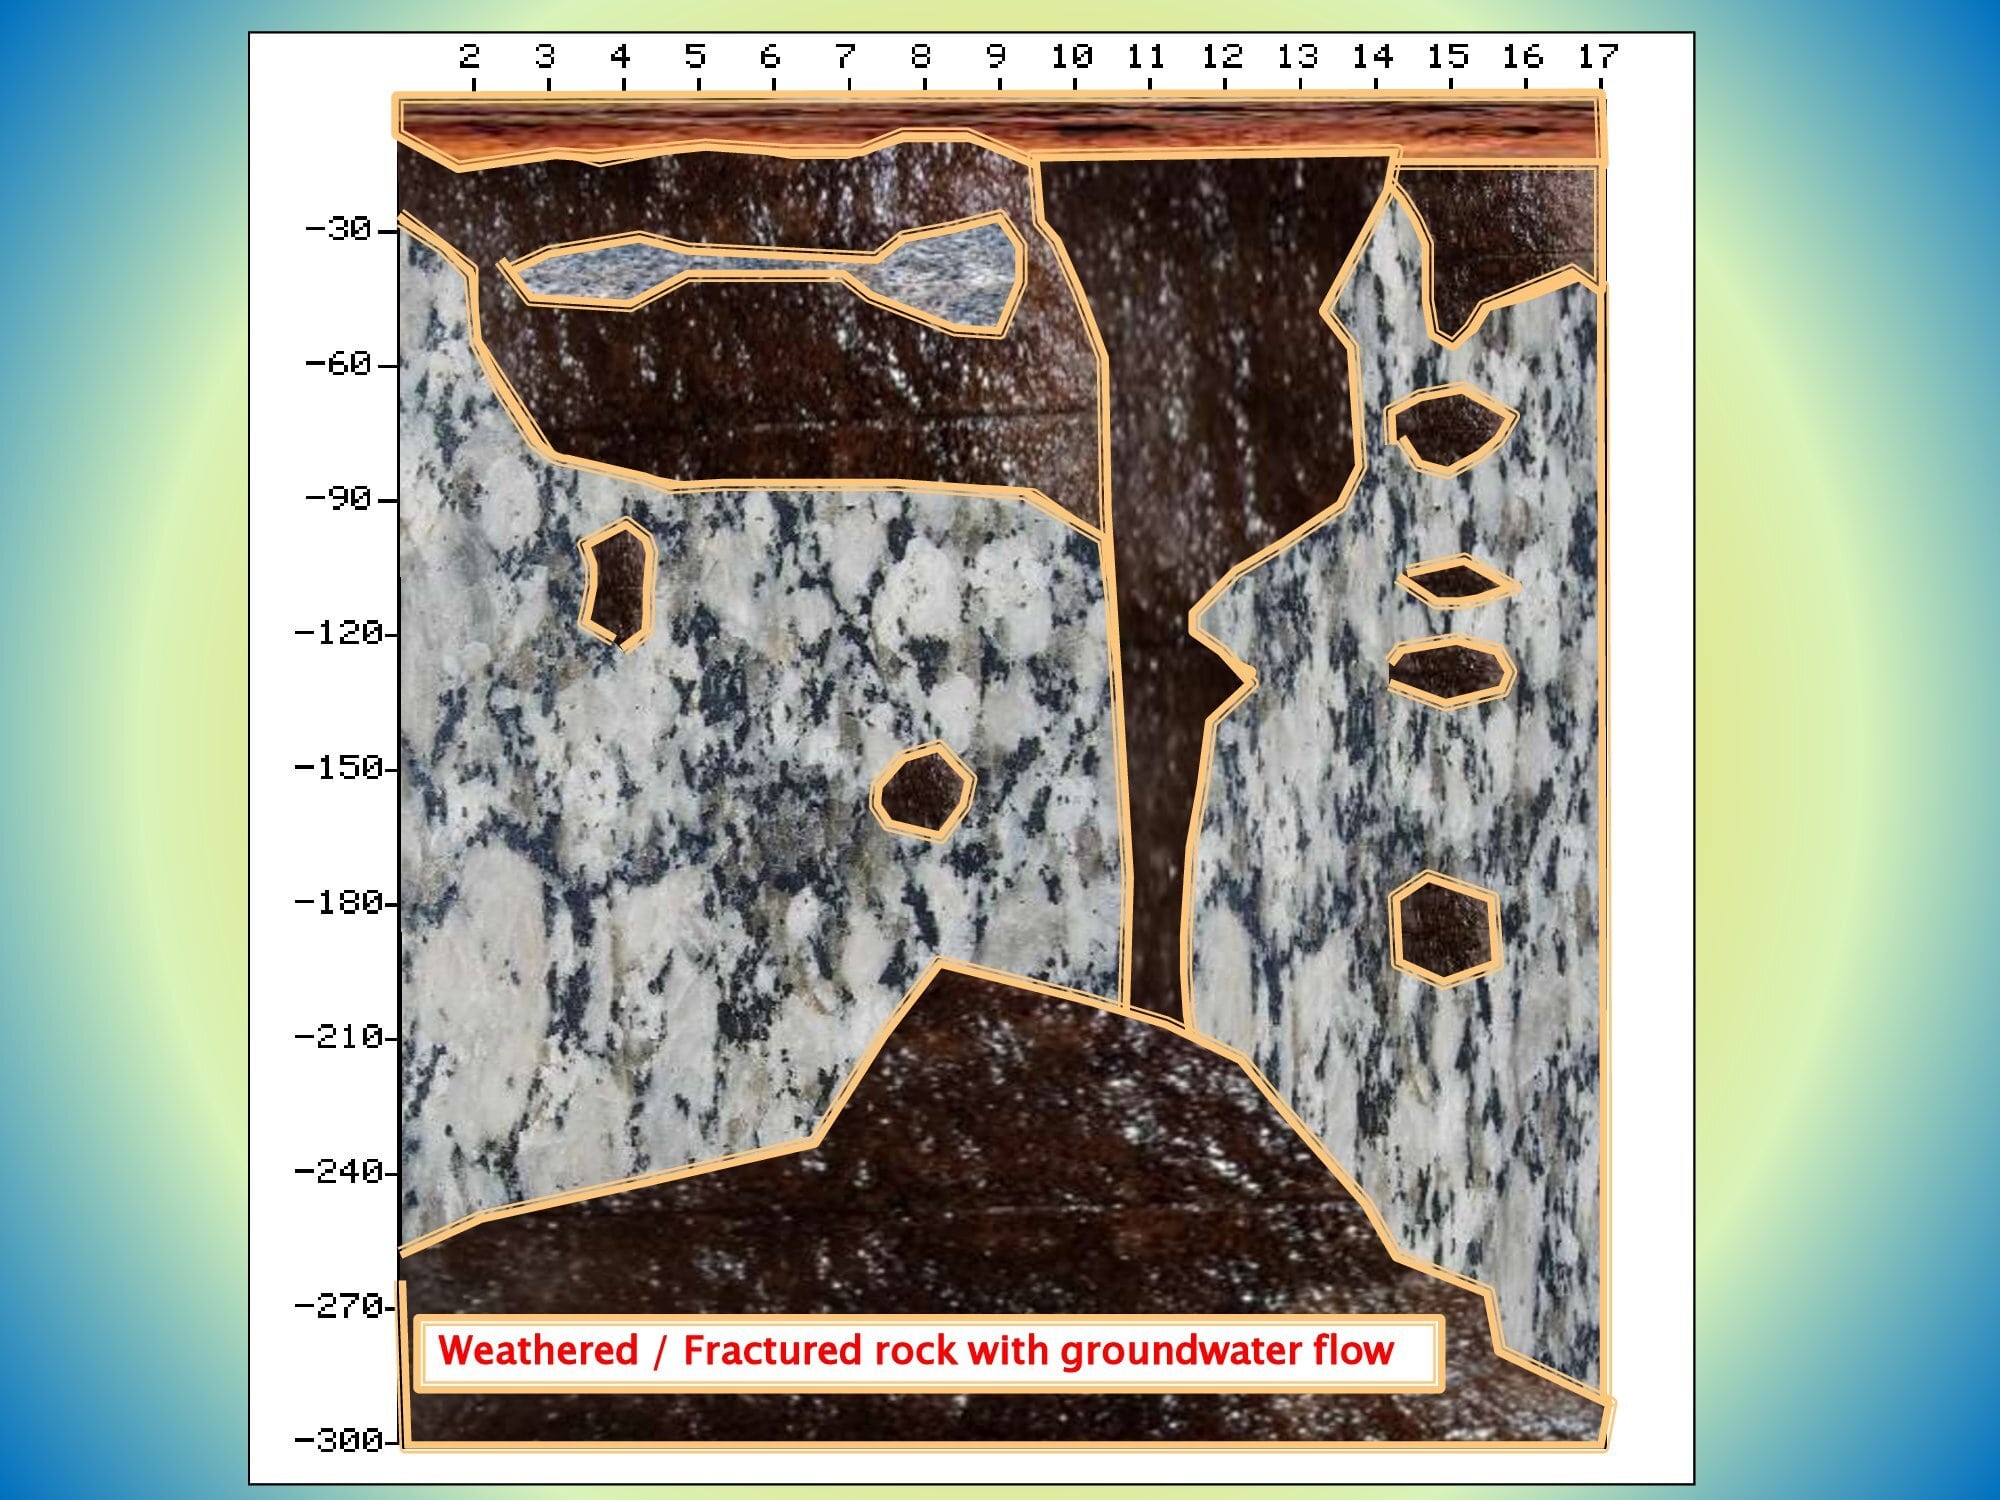
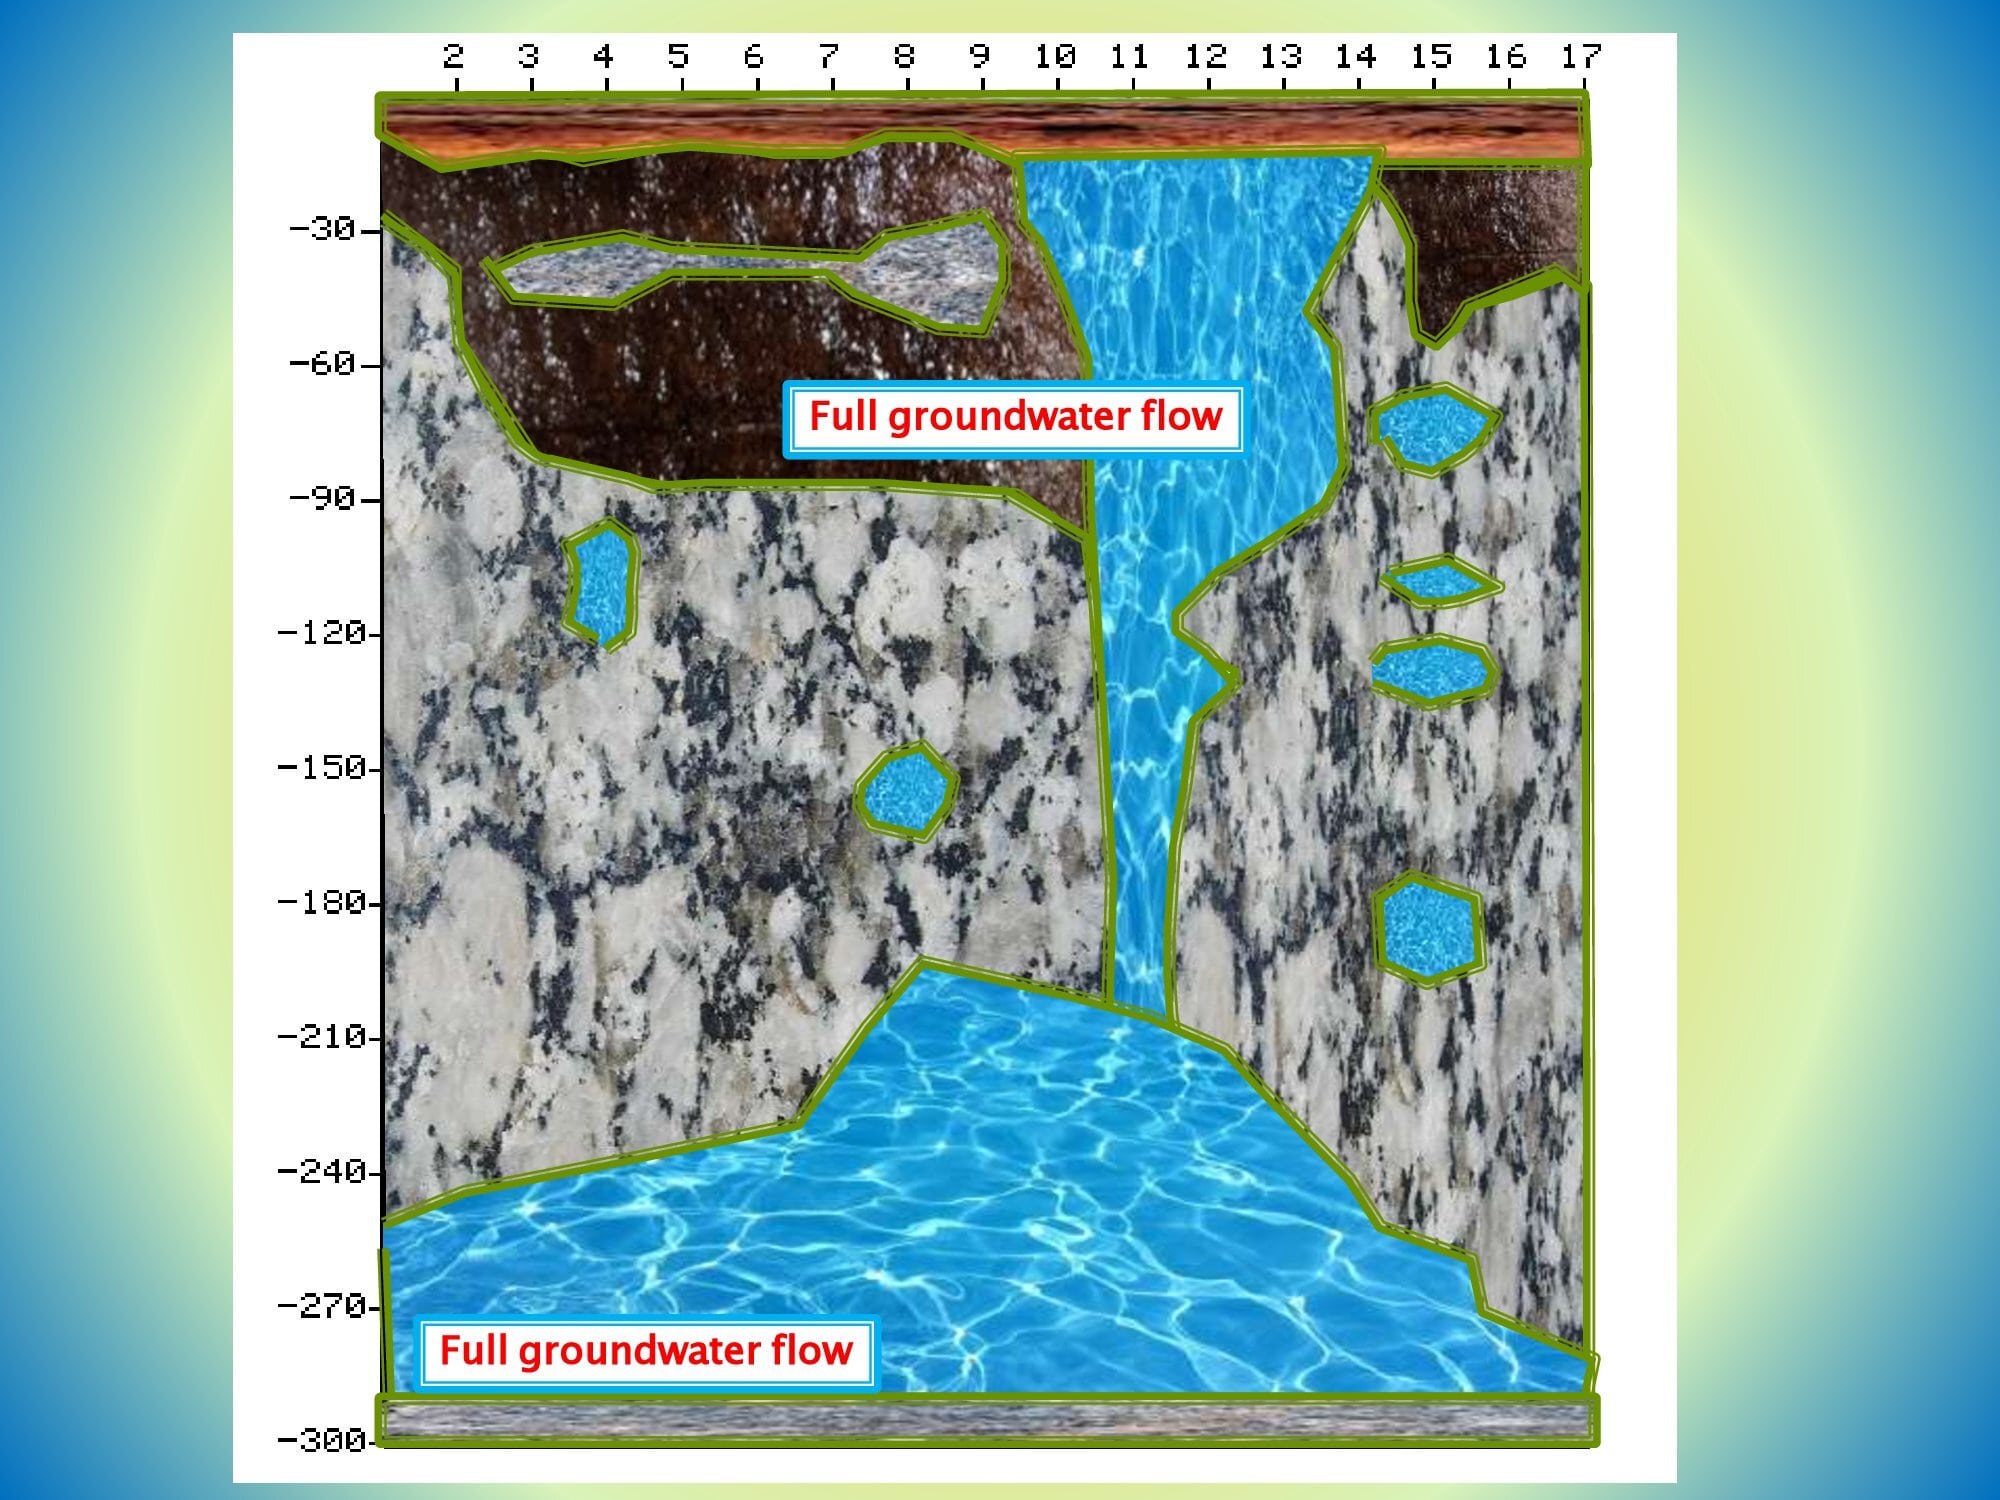
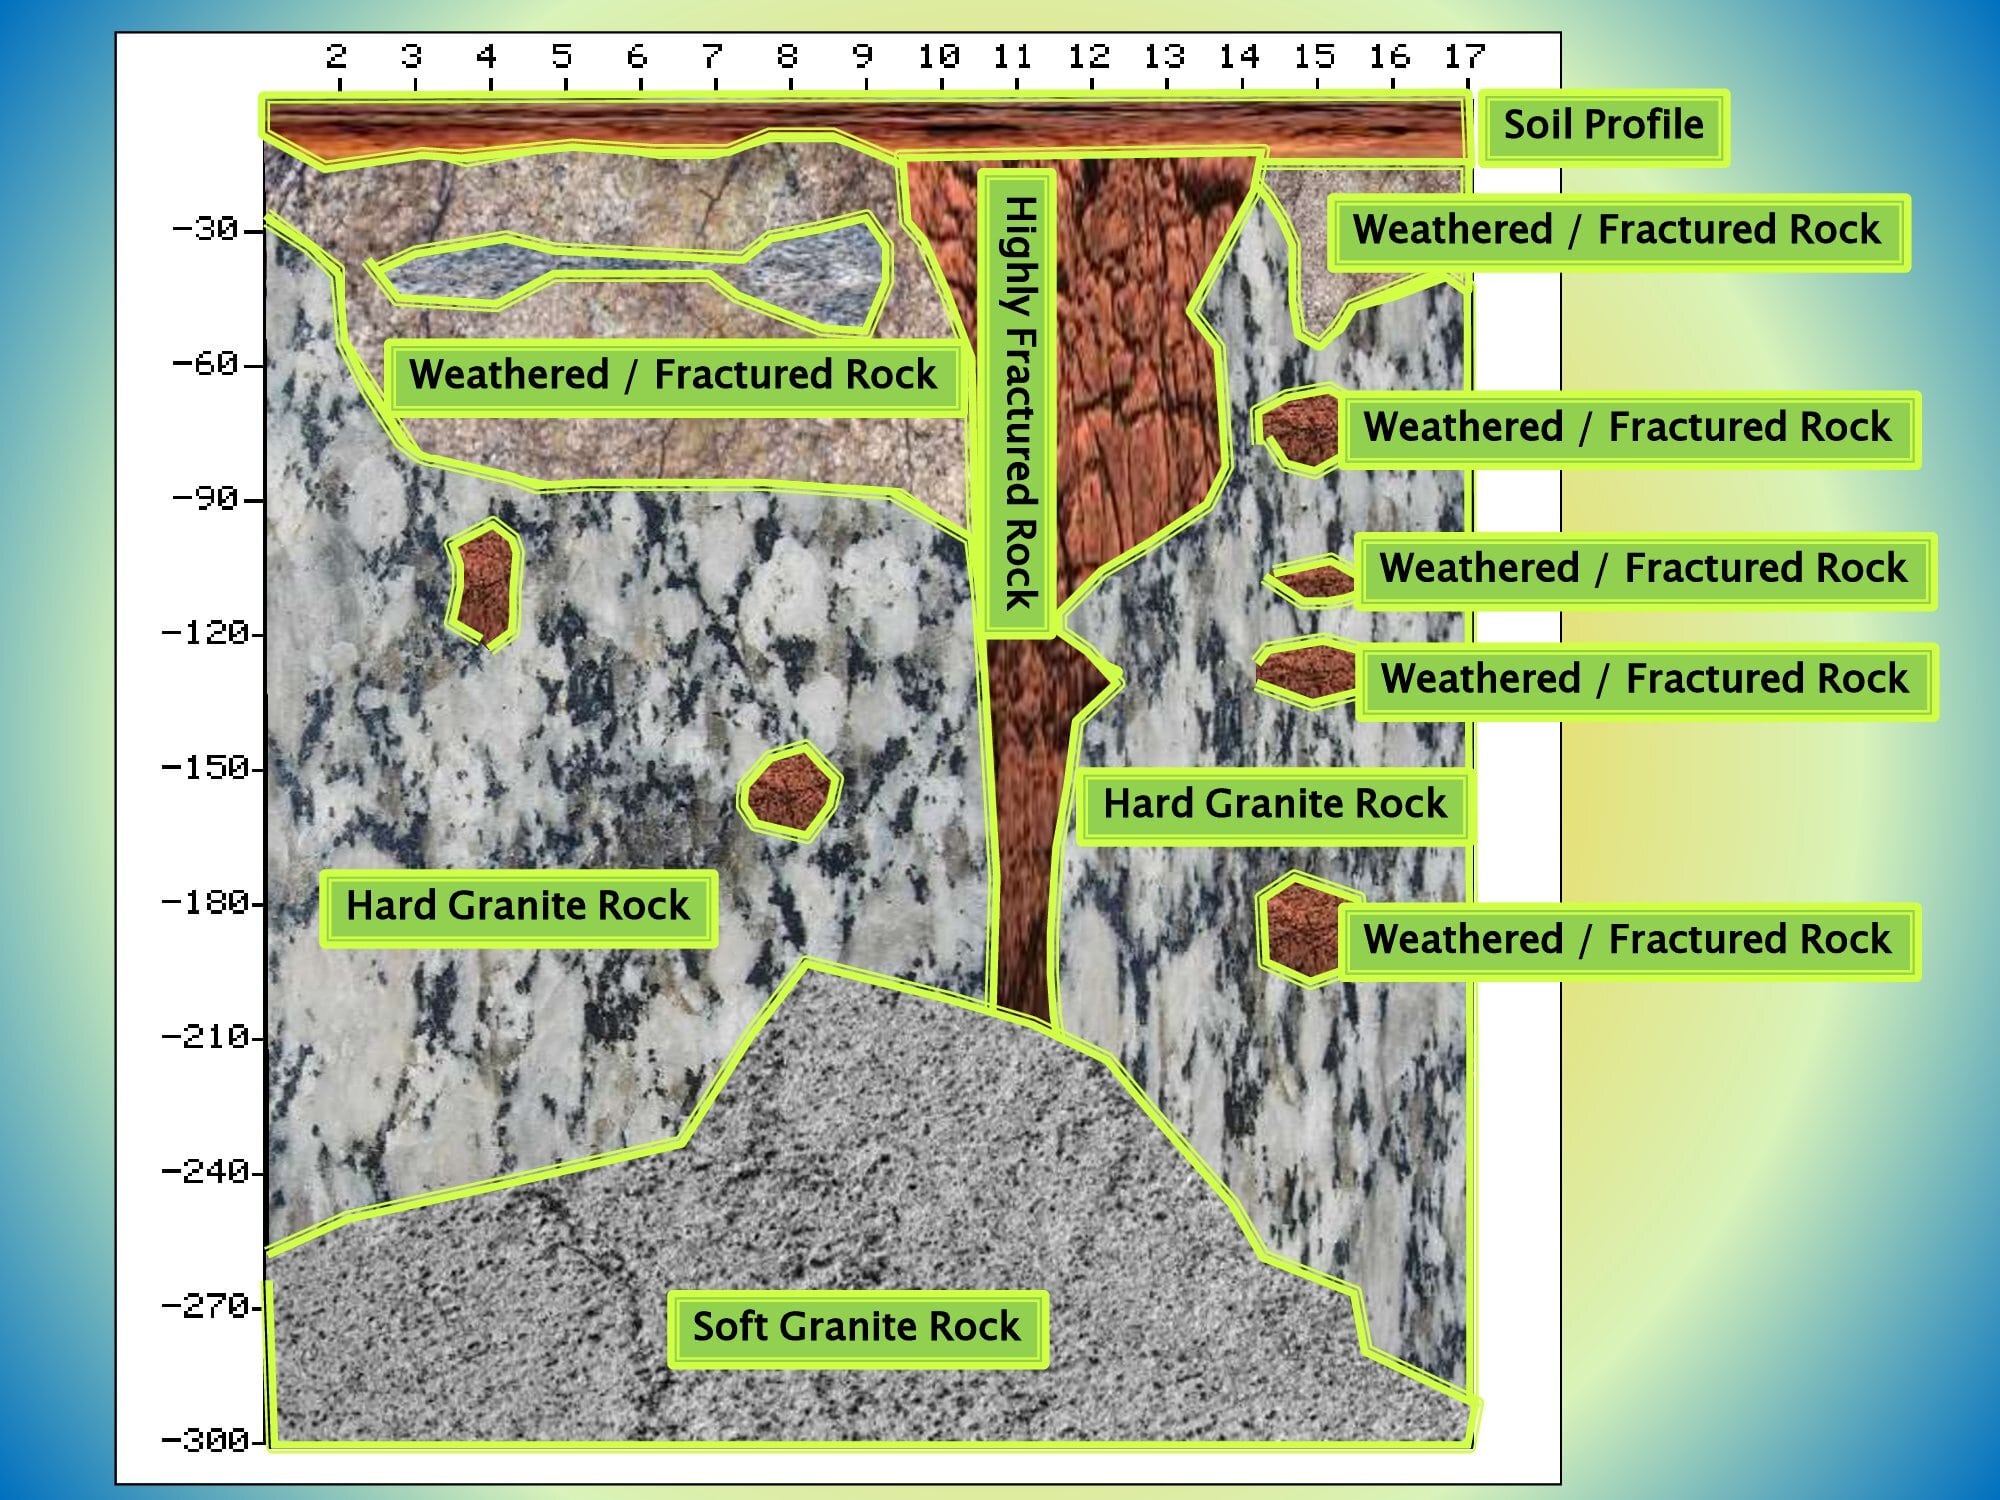
Profile Map & Subsurface Reality                                 
, Analysis of Profile Map in PWQT Water Detector, Sahara Groundwater

Color chart and analysis


What is Color ?

Definition  :  What our eyes see that is being reflected or absorbed by the light .

  • Therefore , without light , you can not see color !
  • One of the most dominant  Elements of Art
  • Color Scheme :  An arrangement of colors


Objective of color scheme 


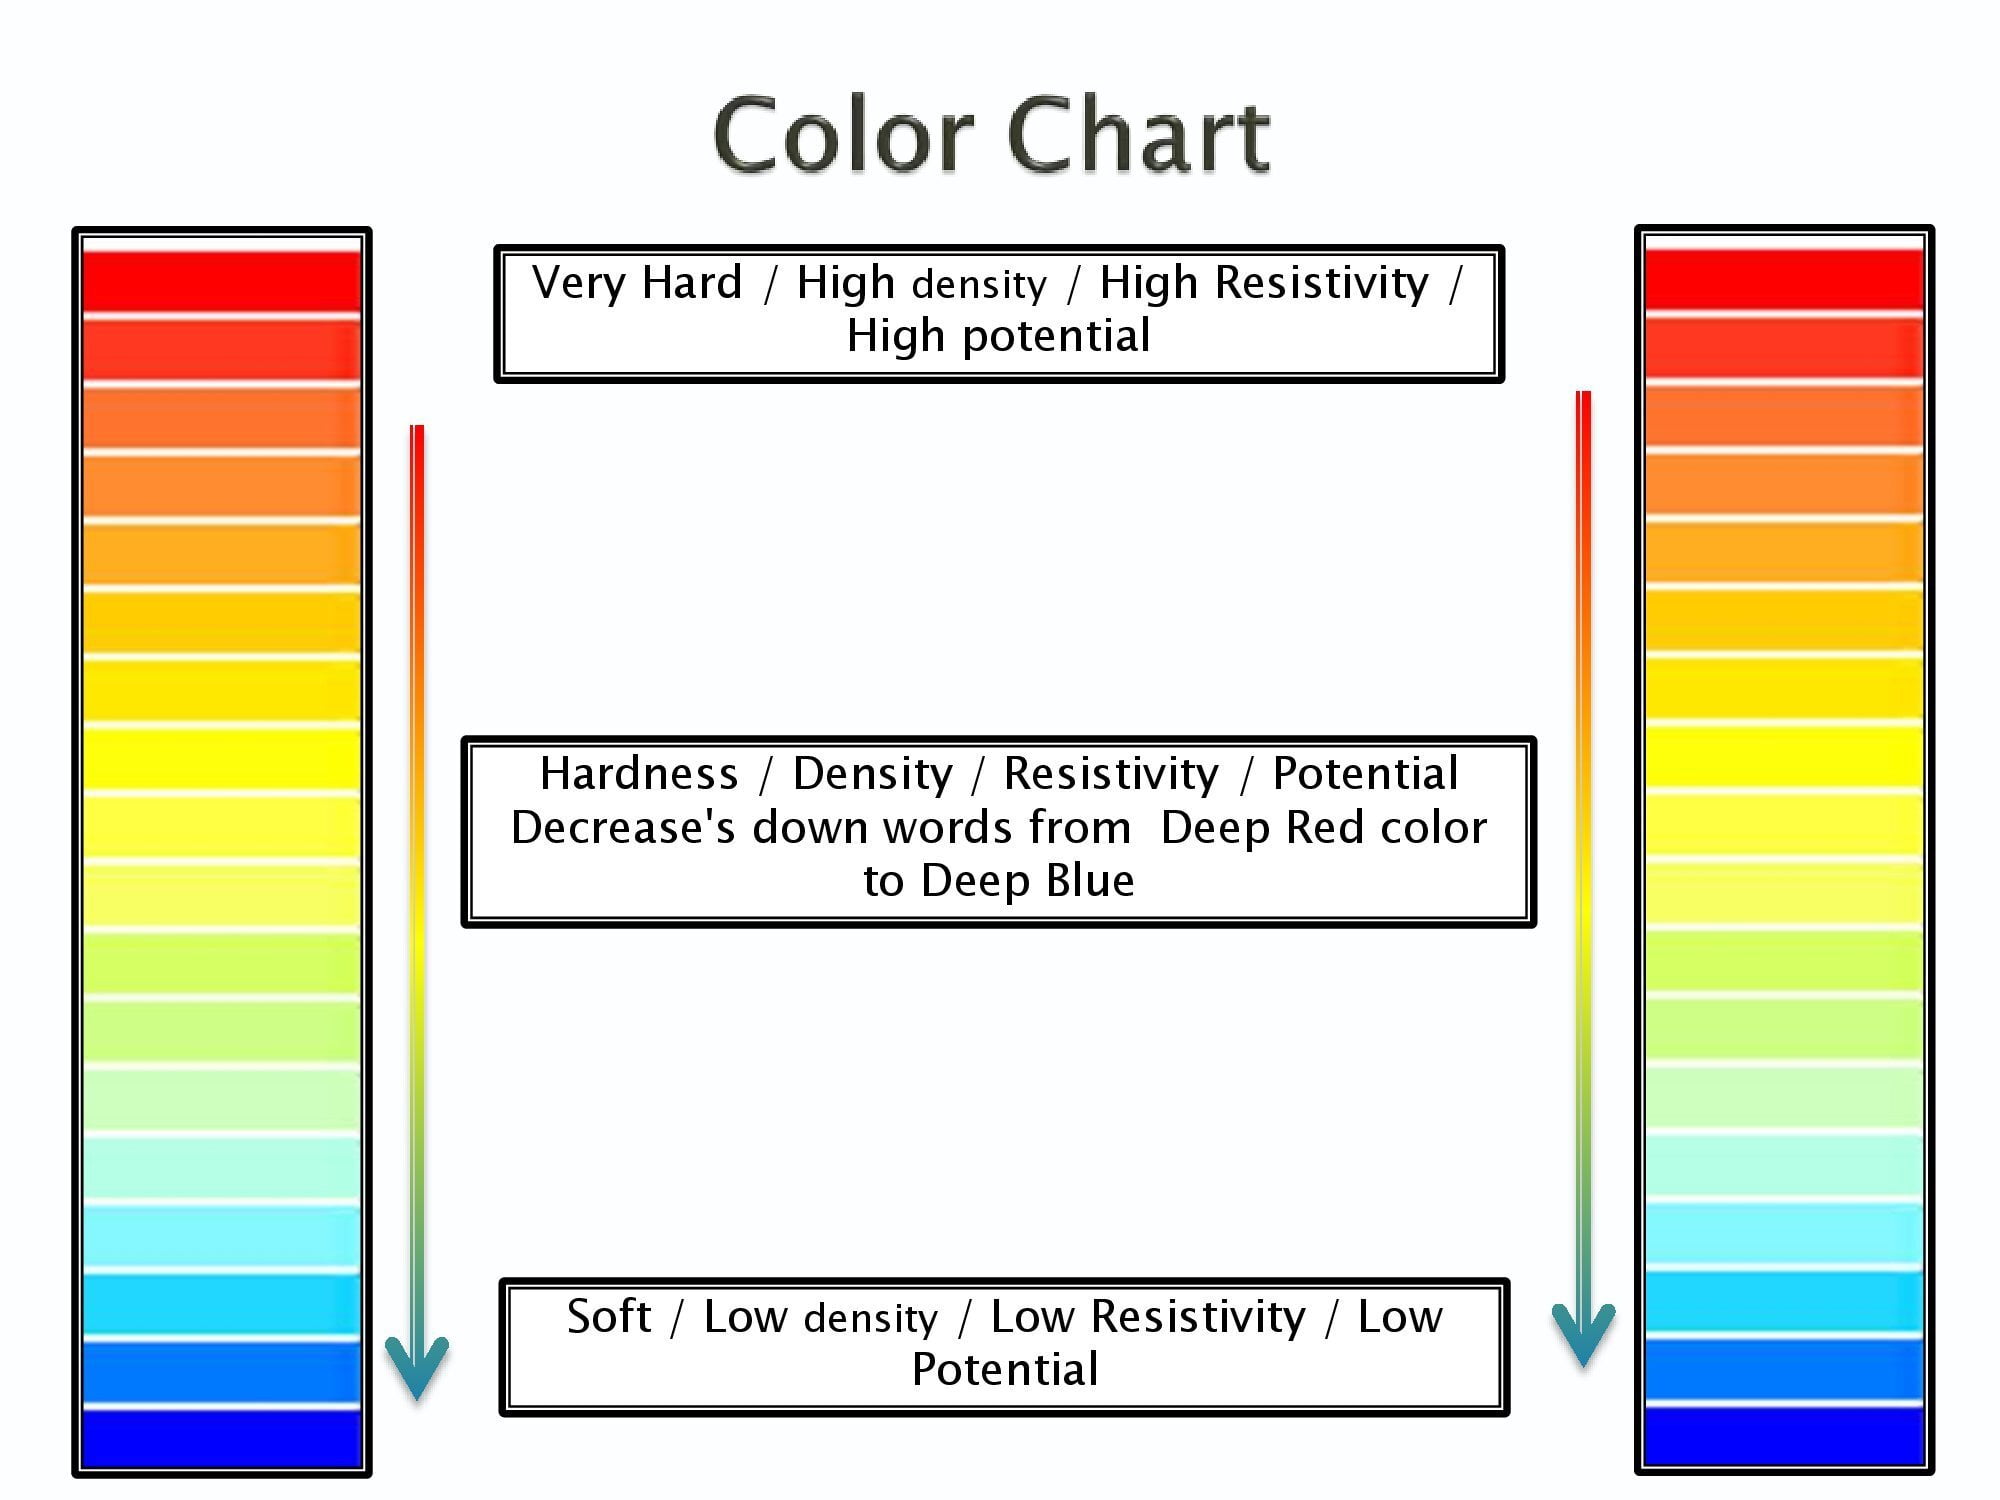
The objective of Color chart is representation , identification , description , variations , comparison , and analysis of subsurface rock formation and its distribution , this chart gives the easy way to identify without any confusion either literate / illiterate people .


As we are reading / watching , make a note of things we find interesting , important , or insightful when we finish a project , in this way we choose color , the scheme stands for best represents and capture’s of essence of the ideas , this is all well and good for interpretation of map .
, Analysis of Profile Map in PWQT Water Detector, Sahara Groundwater

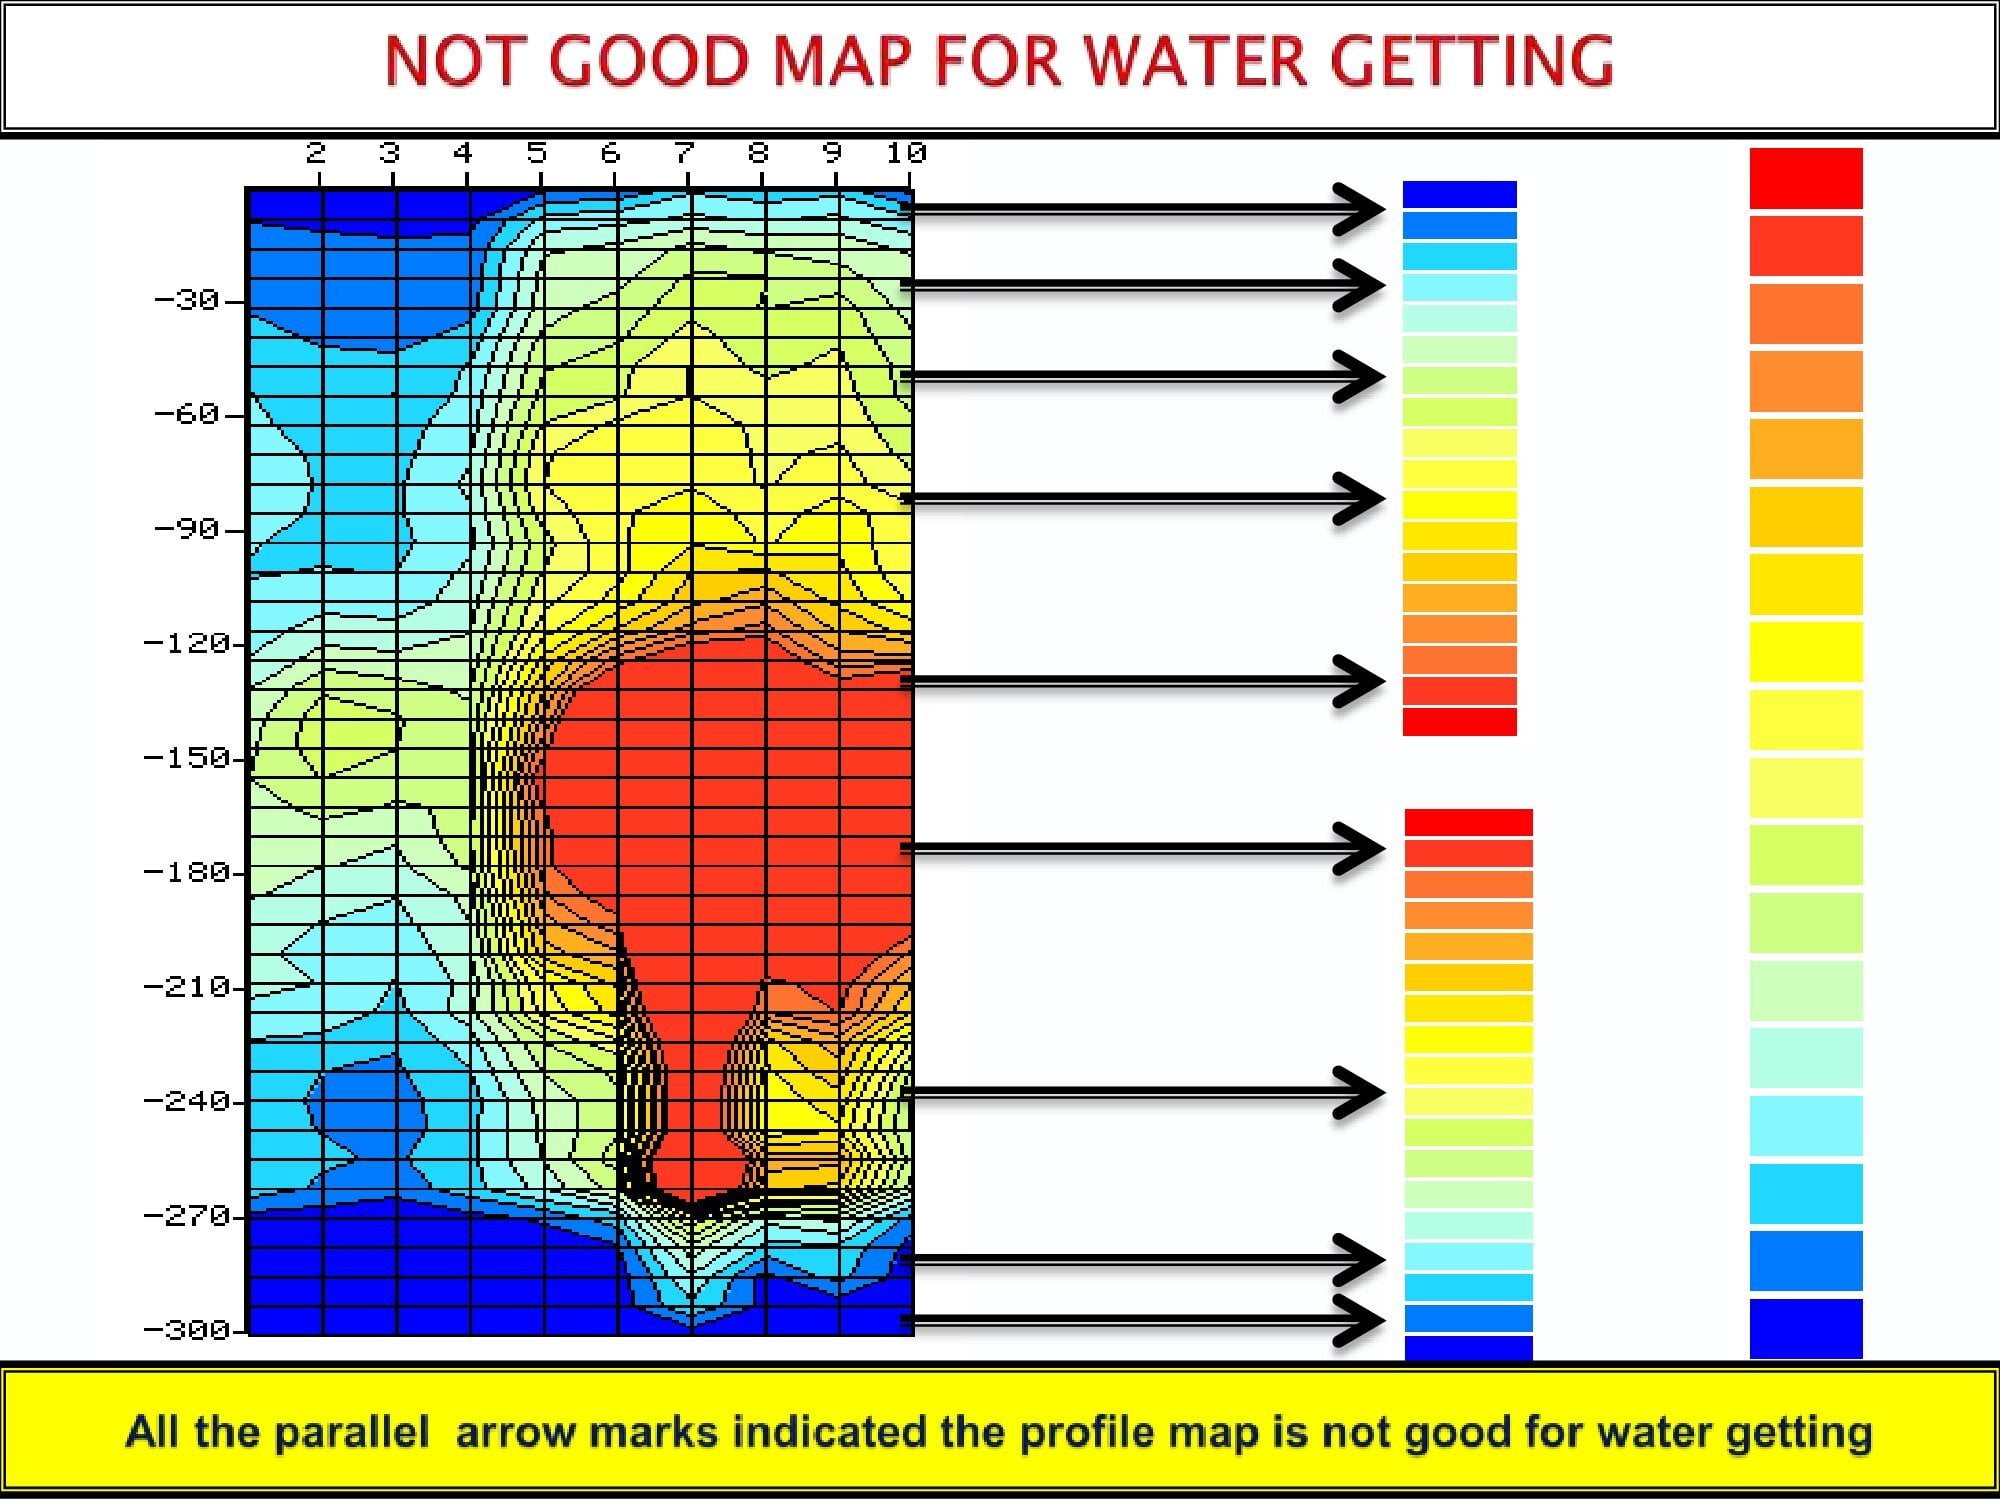
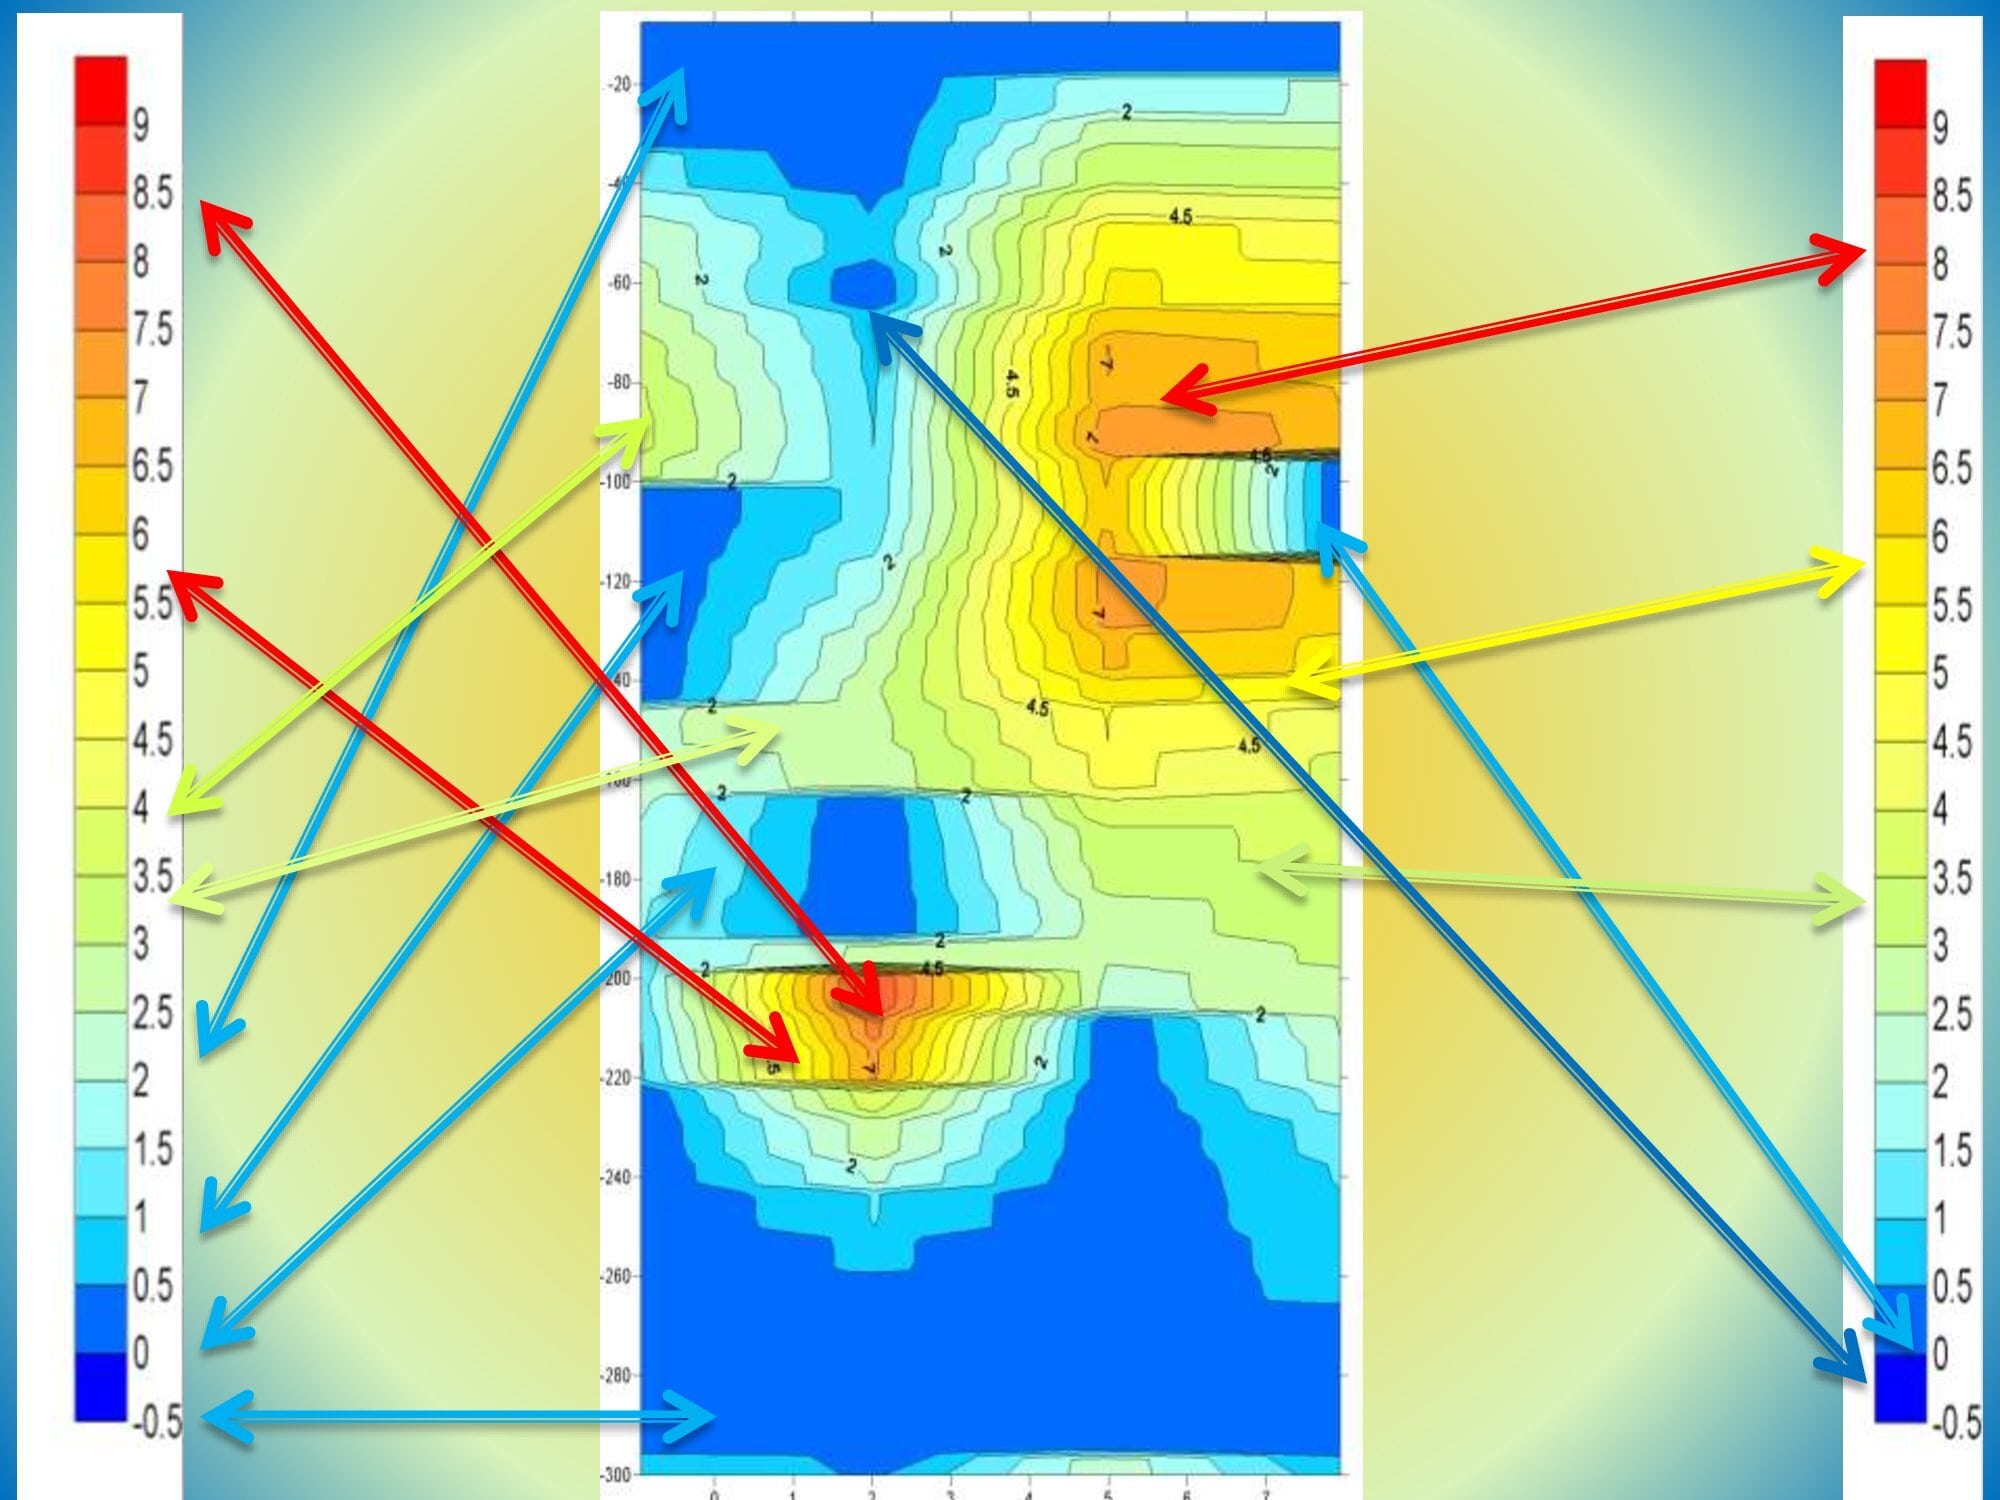
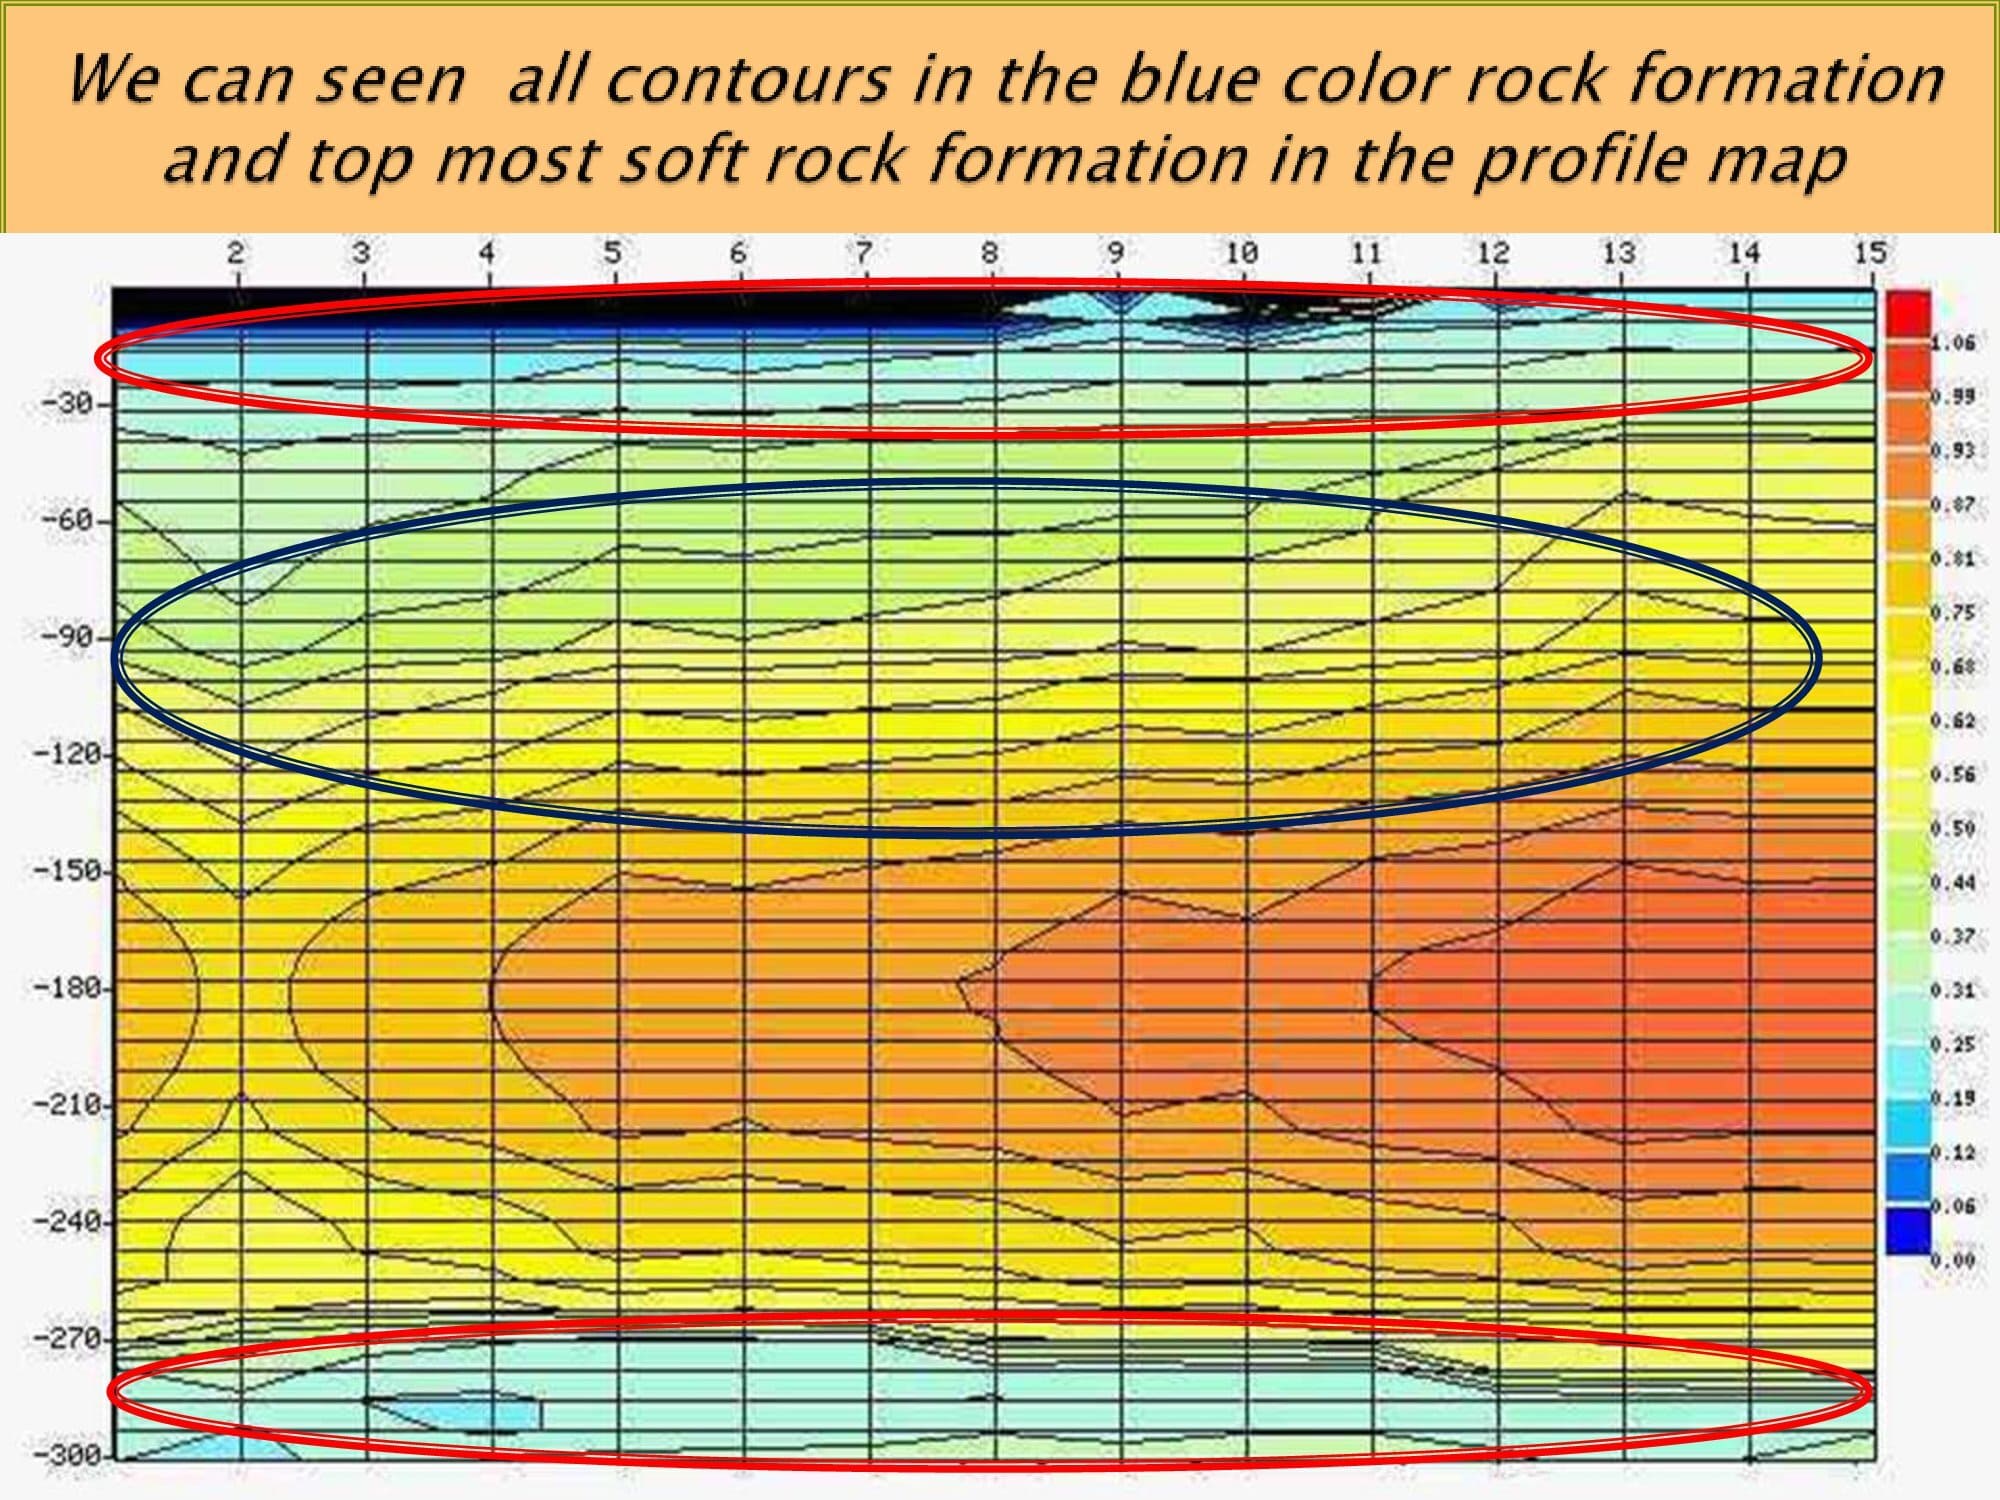
Red Color             –    represents highly strengthen / high resistivity of rock formation , and the color indicate danger symbol , we don’t get water in this zones / getting in limited areas .

Orange Color      –   represents less than the highly strengthen rock formation , this color also indicates some of danger zone , here we don’t get water in this zones / getting in the limited areas .

Yellow Color        –   represents medium strengthen rock formation , this color also indicates warning to getting water in this zones .

Green Color         –   represents the less-than medium strengthen rock formation , this color also indicates starting of water zones .

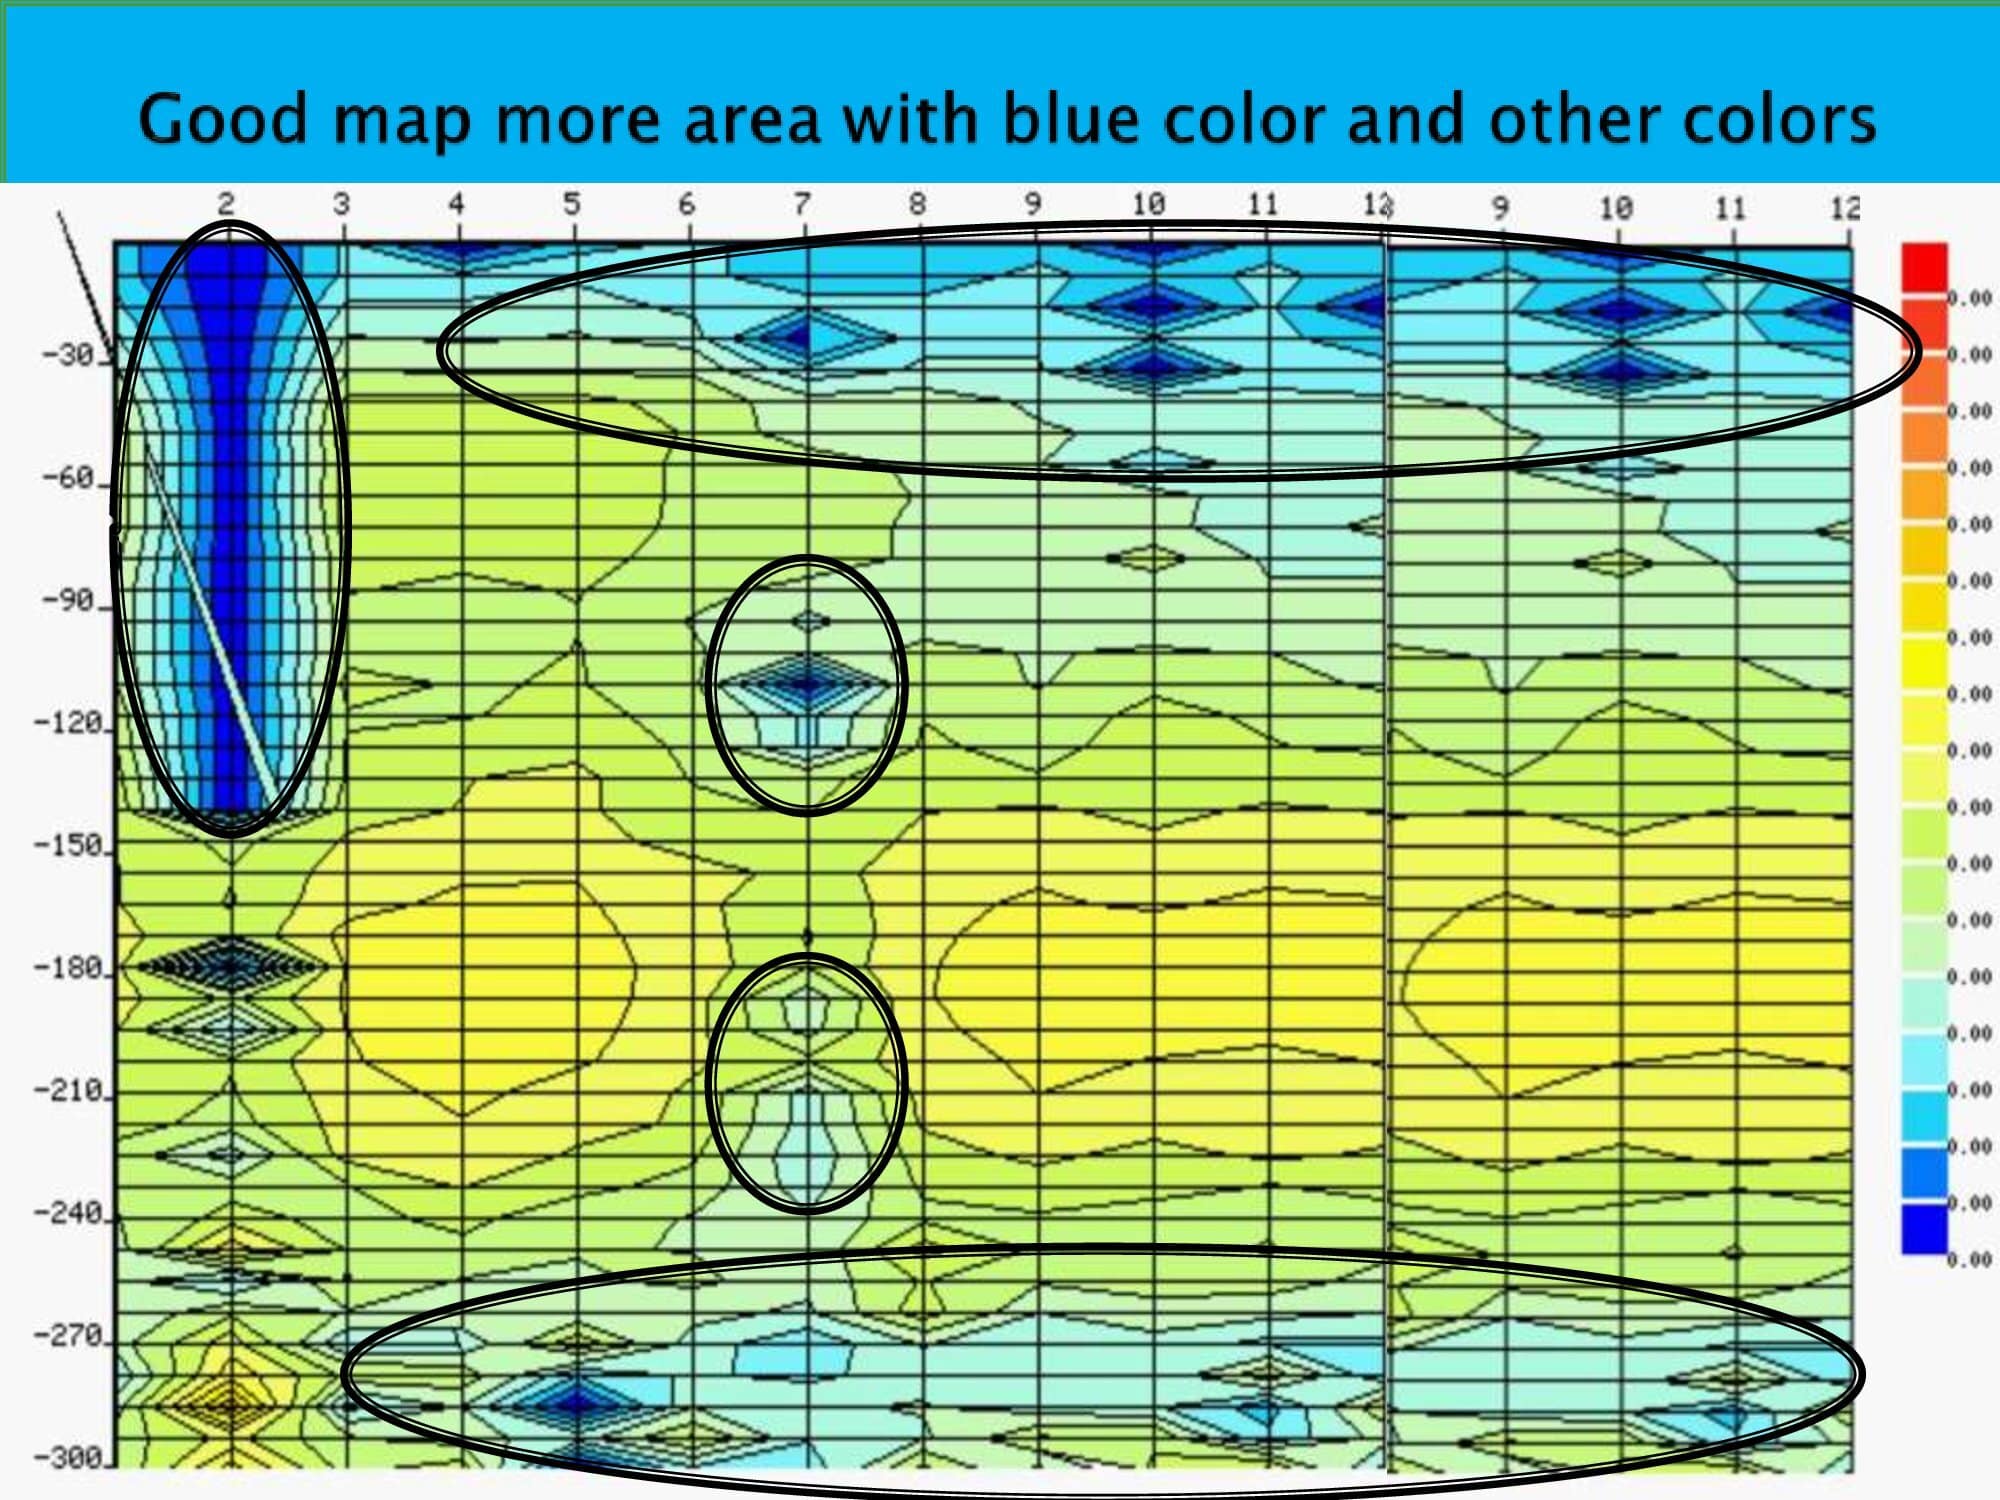
Light Blue Color –   represents the soft rock formation / water bearing rock formation , this color indicates wealthy chances of getting water in the zone .

Blue Color            –  represents the soft rock formation / water bearing rock .

Color chart and analysis

, Analysis of Profile Map in PWQT Water Detector, Sahara Groundwater

Values Range Analysis

, Analysis of Profile Map in PWQT Water Detector, Sahara Groundwater

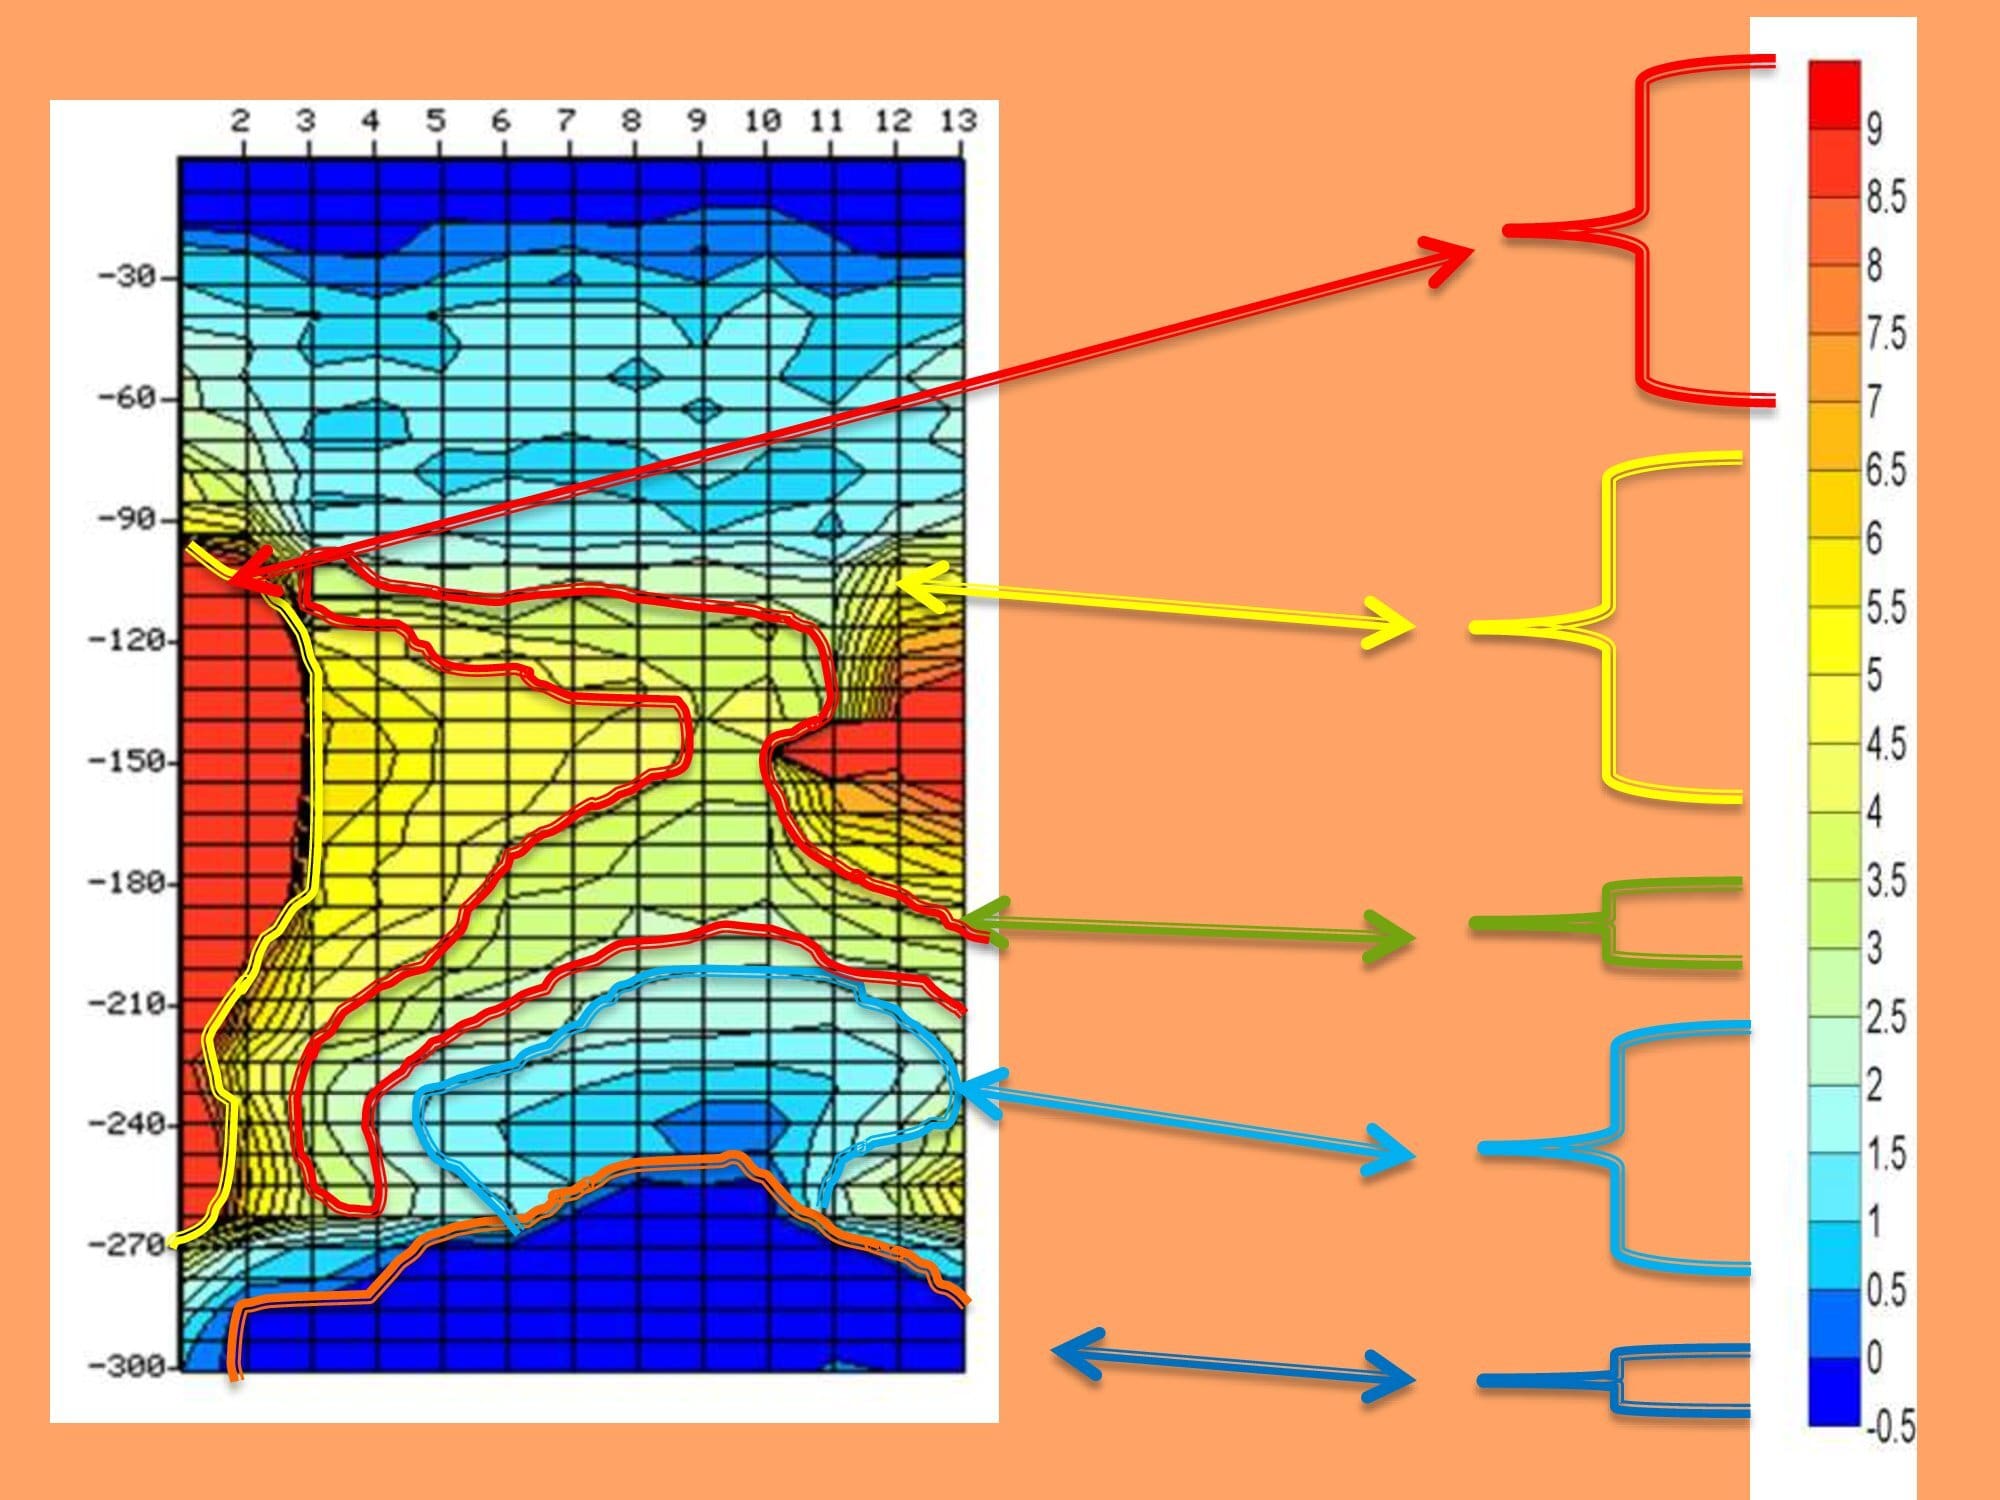
Contour & Analysis

An outline representing or bounding the shape or form of subsurface material .

  • The contour stresses the quality of an outline or a bounding surface as being smooth, jagged, curving, or sharply angled .
  • Useful to know the shape and size, length and width of solid / material’s measurements and fractures length and width .
, Analysis of Profile Map in PWQT Water Detector, Sahara Groundwater


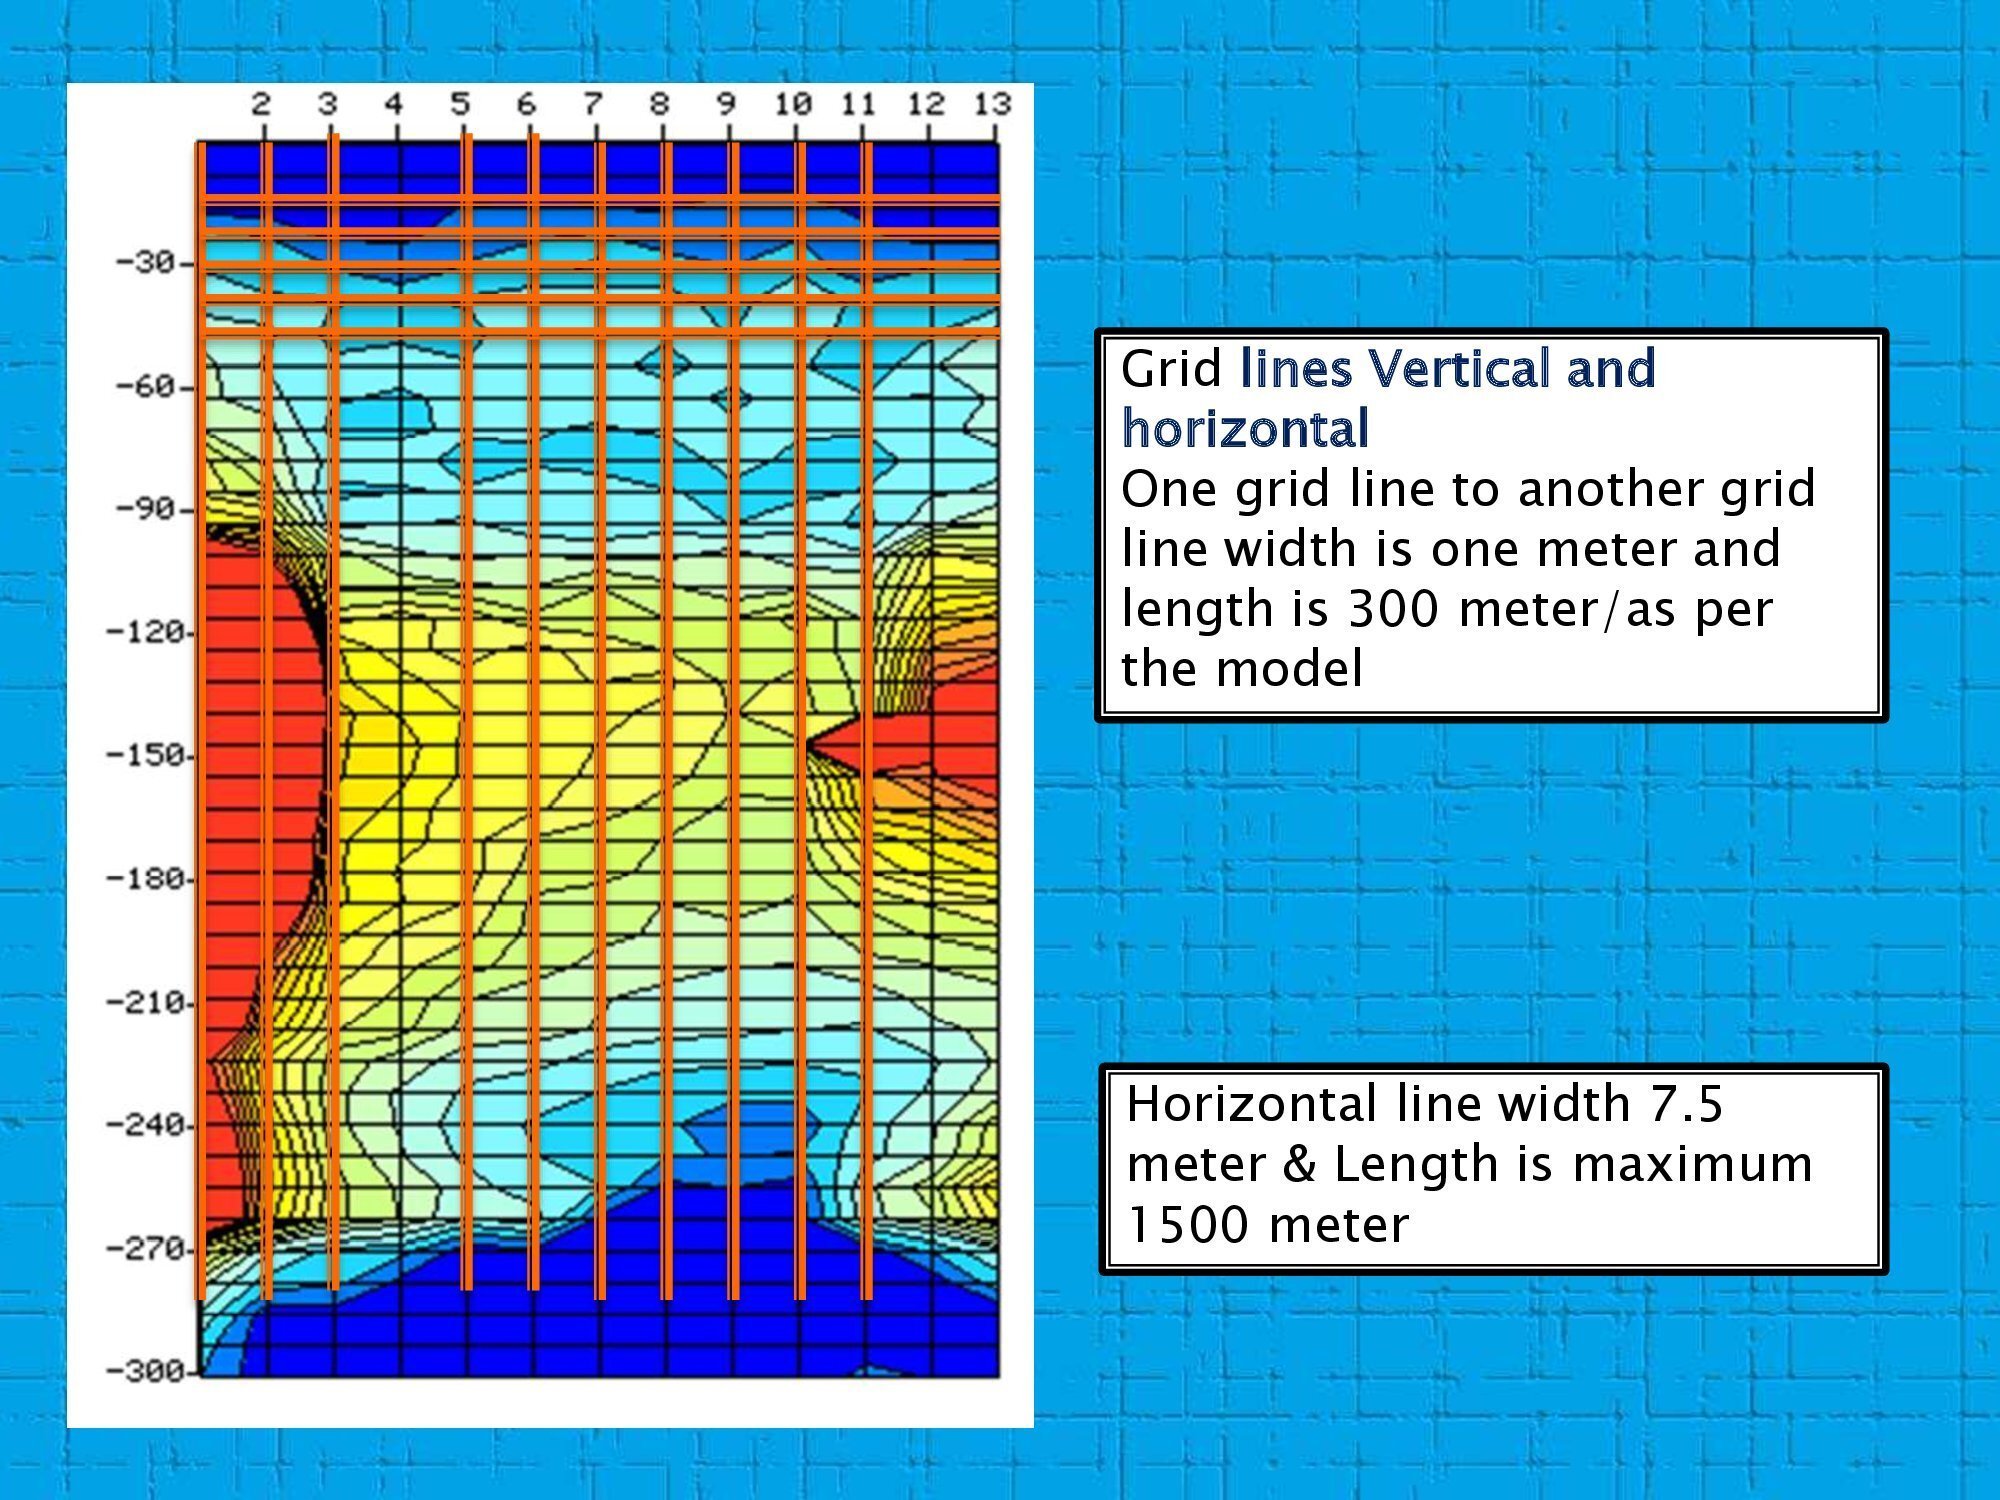
Grid Lines


What is GRID

A network of lines that cross each other to form a series of squares or rectangles, 

or

In graphic design , a grid is a structure made up of a series of intersecting straight (vertical, horizontal, and angular) or curved lines.

The Benefits of Using a Grid. … Efficiency and quickly understanding, Grids make it easier for any person to work .
, Analysis of Profile Map in PWQT Water Detector, Sahara Groundwater

Uses Of Gridlines

Length and width of grid lines given the measurement and distribution view of the subsurface materials in the profile map based on this measurement we can estimate the shape, size and distribution of the subsurface material’s ex:

The Red color rock portion is distributed from point 1 to point 3 and point 10 to 13 point

The Yellow color rock portion is distributed from point 1 to point 13

The Blue color rock portion is distributed from point 1 to point 13


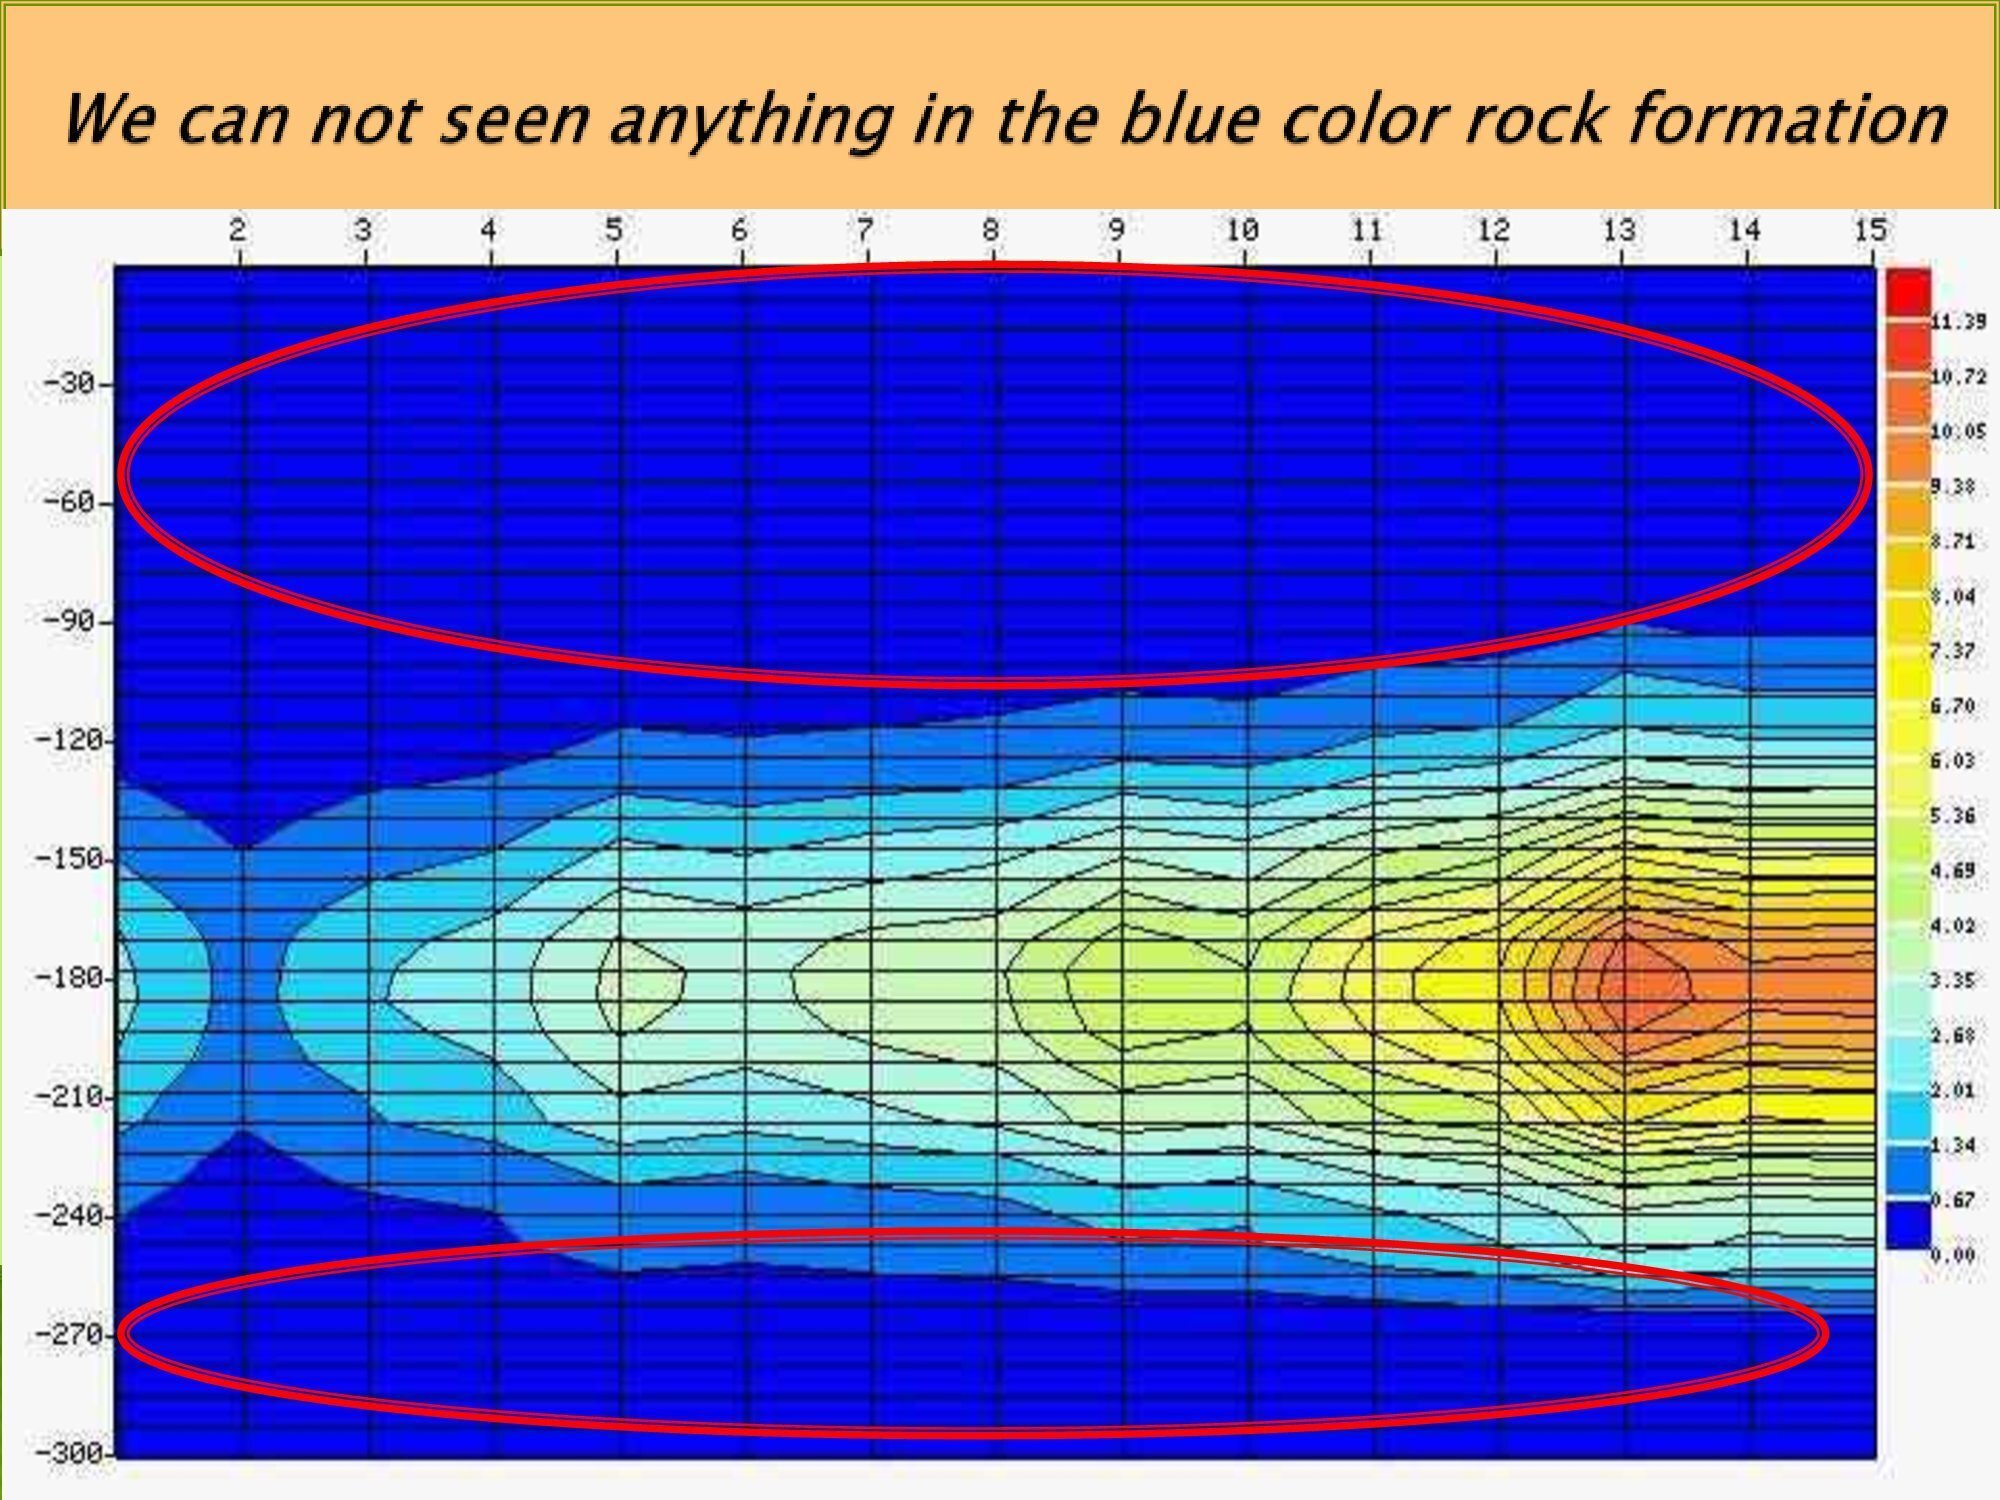
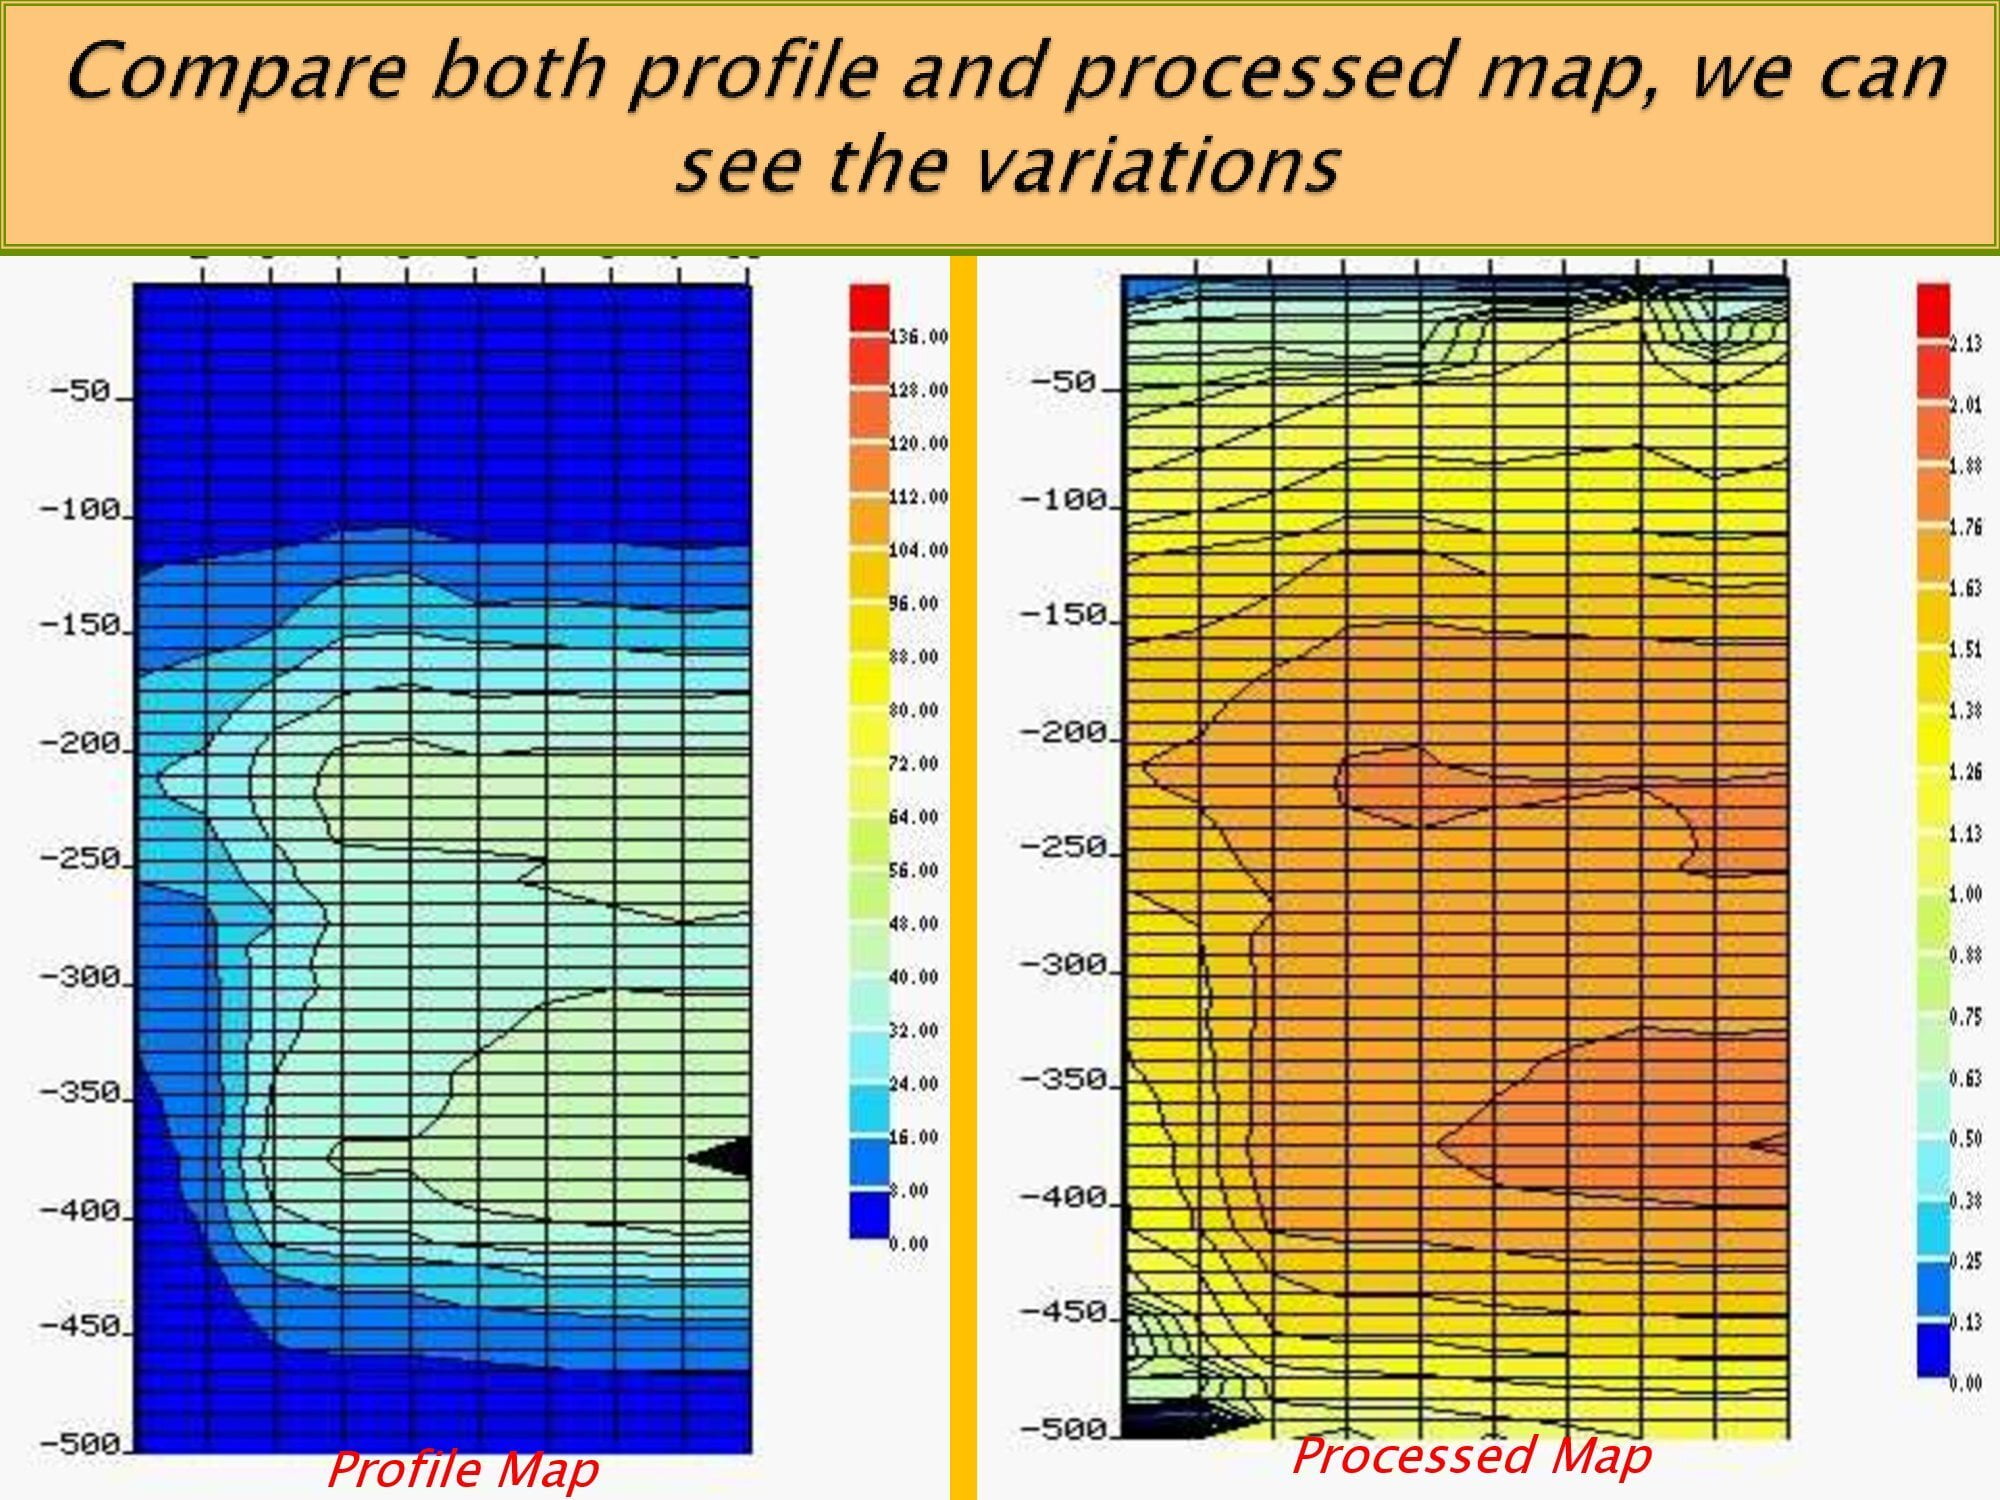
Processed Map and Analysis


What is a Process Map?

A process is a structured set of activities in the instrument that transform inputs into outputs .

Processed maps are used to develop a better understanding discussion and communication of targeting objective .
, Analysis of Profile Map in PWQT Water Detector, Sahara Groundwater


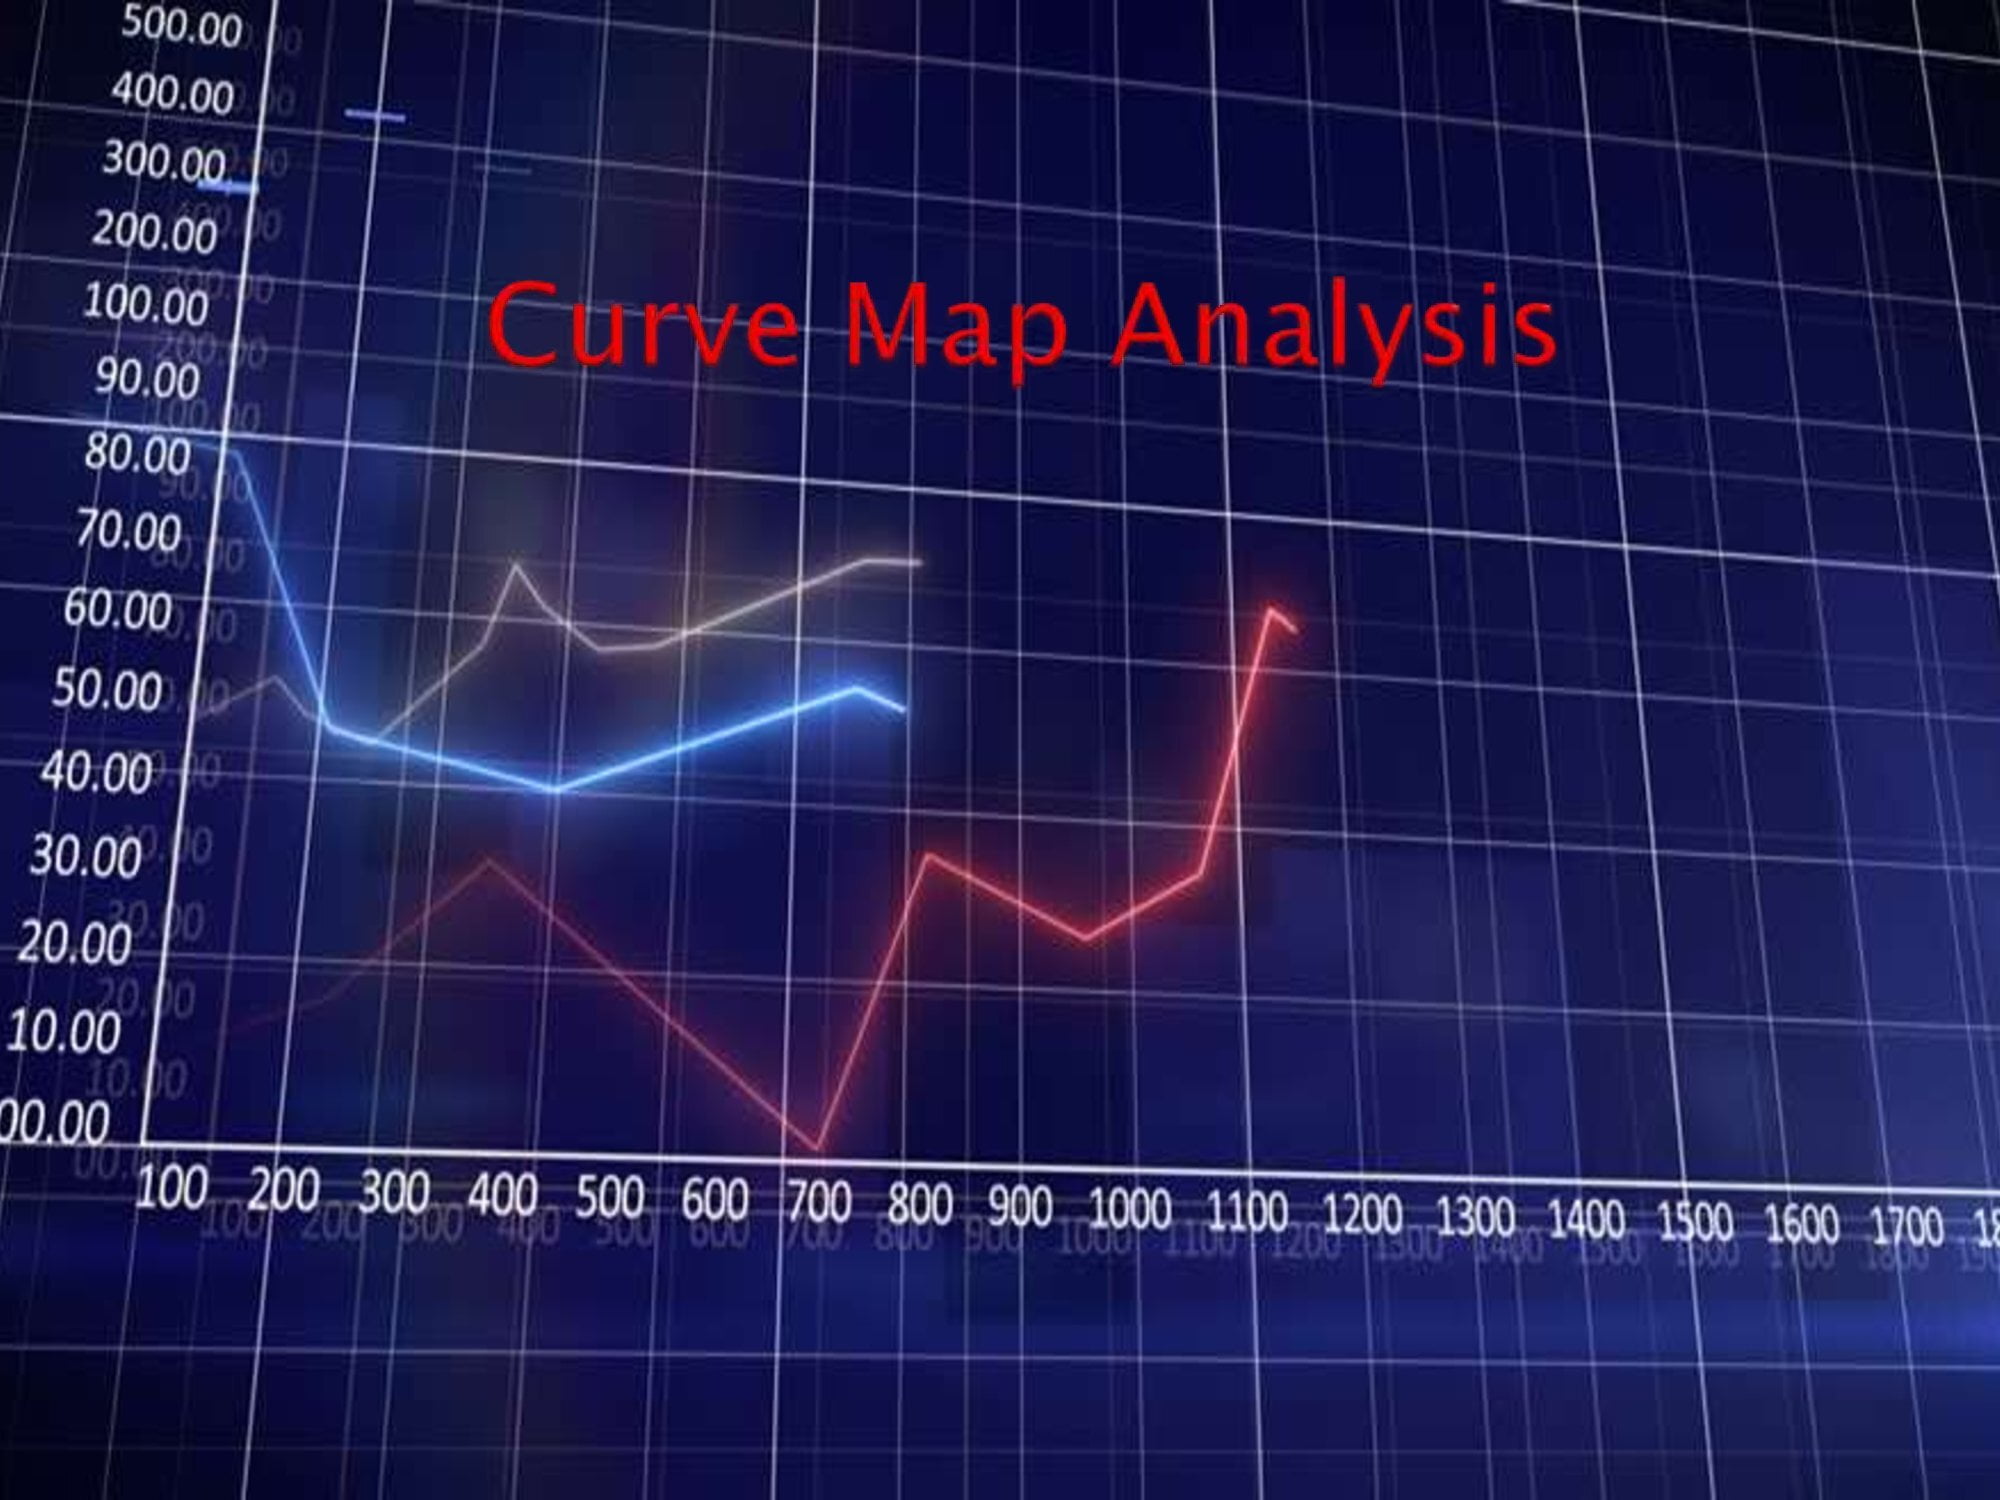
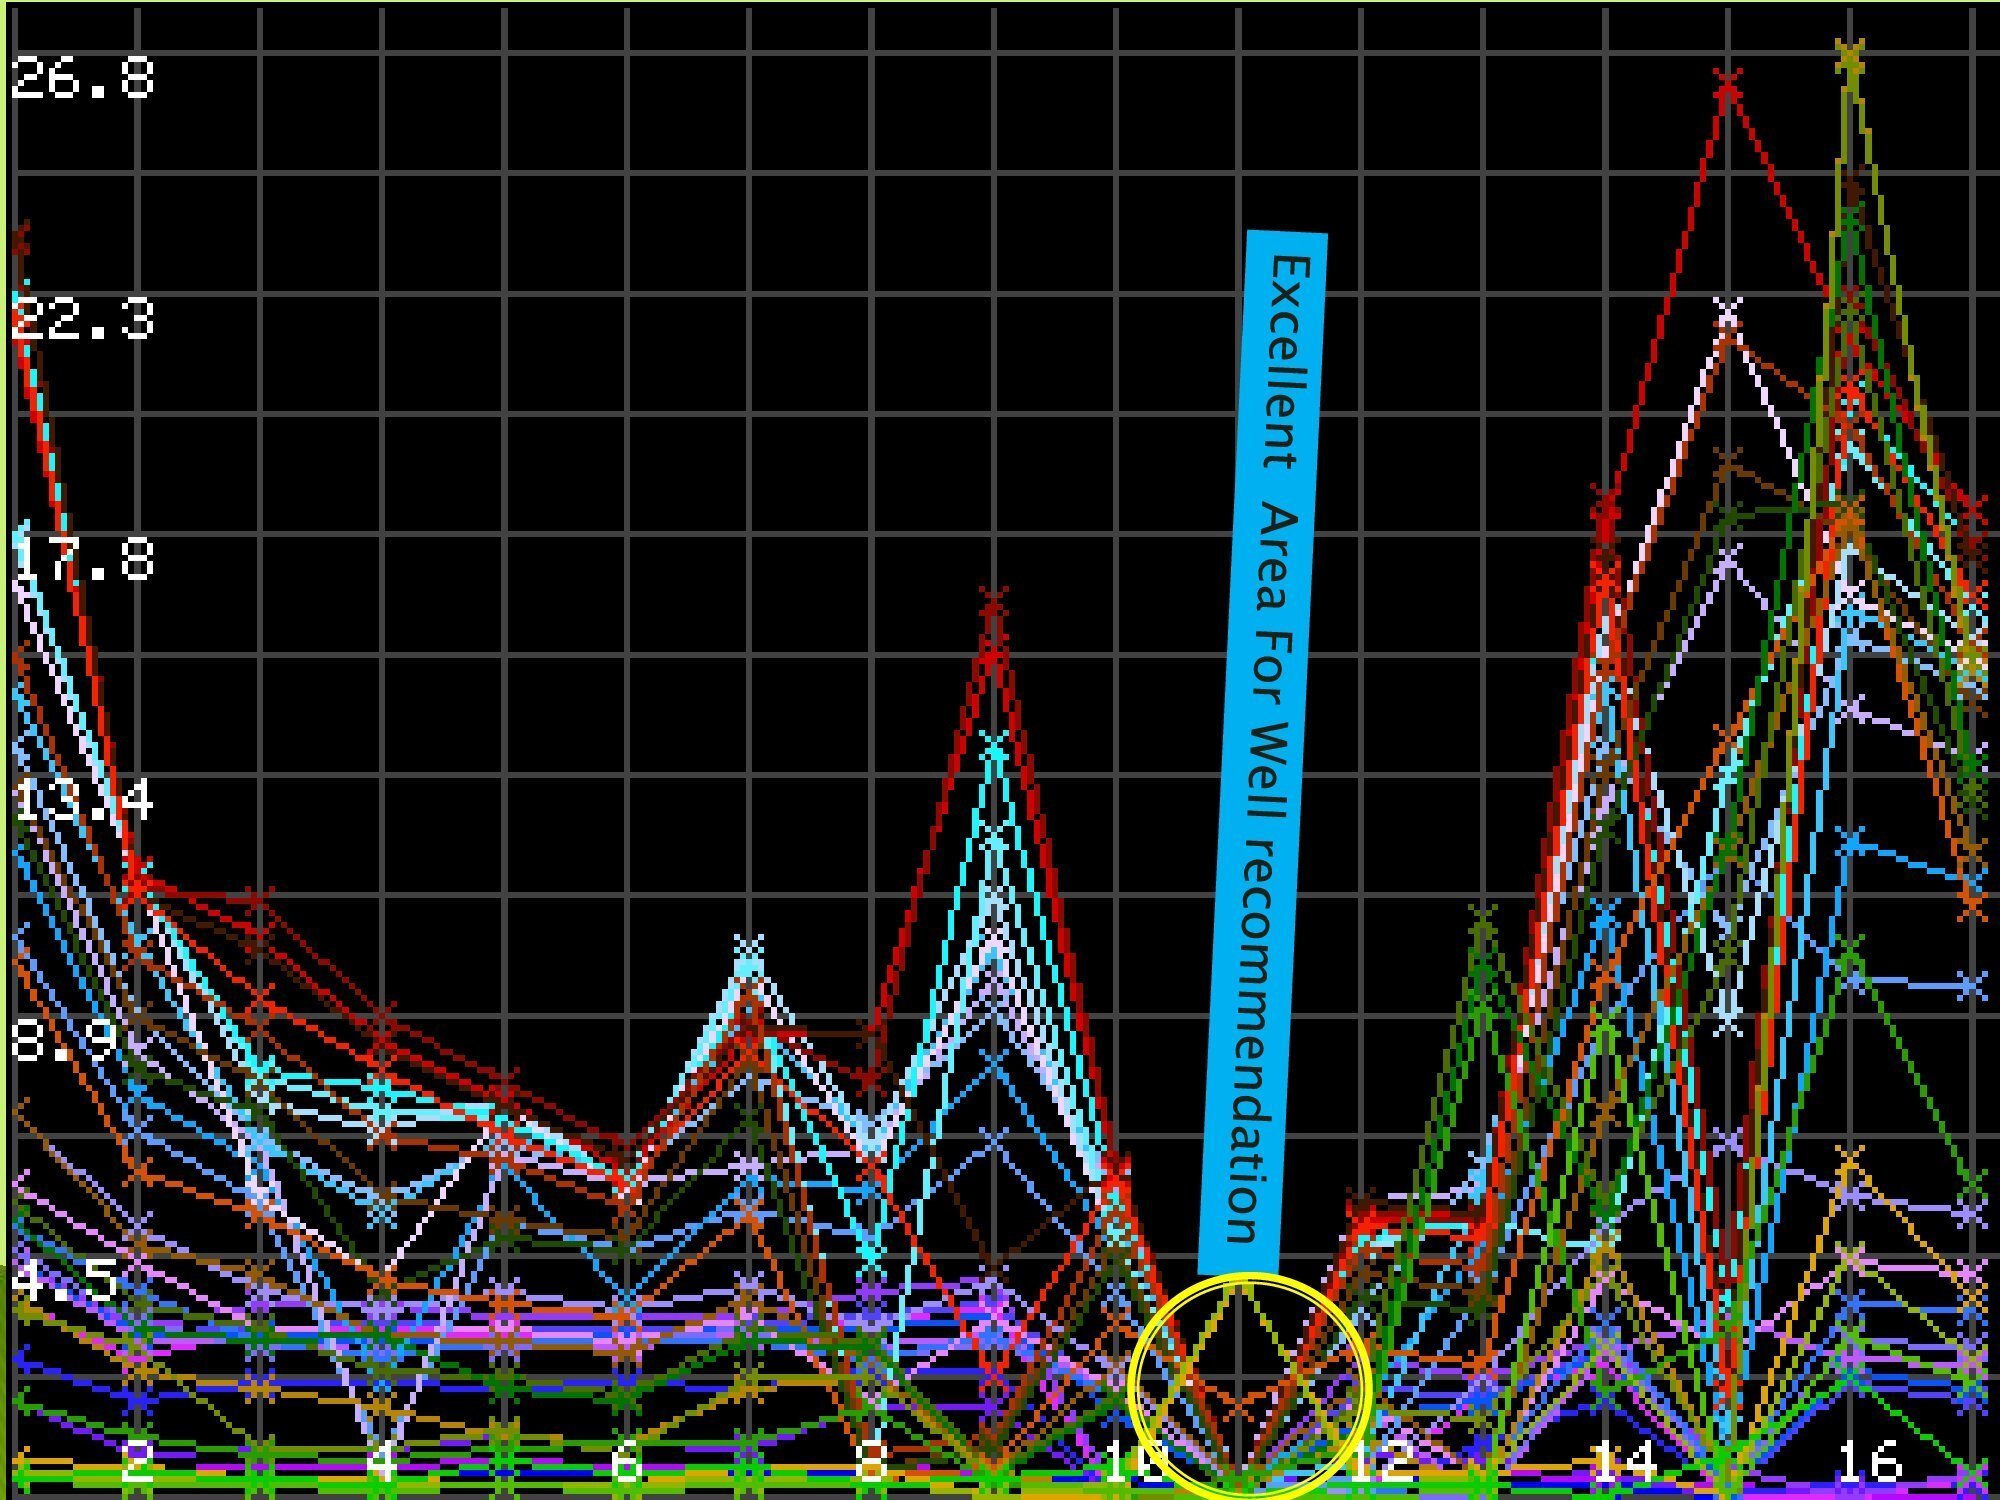
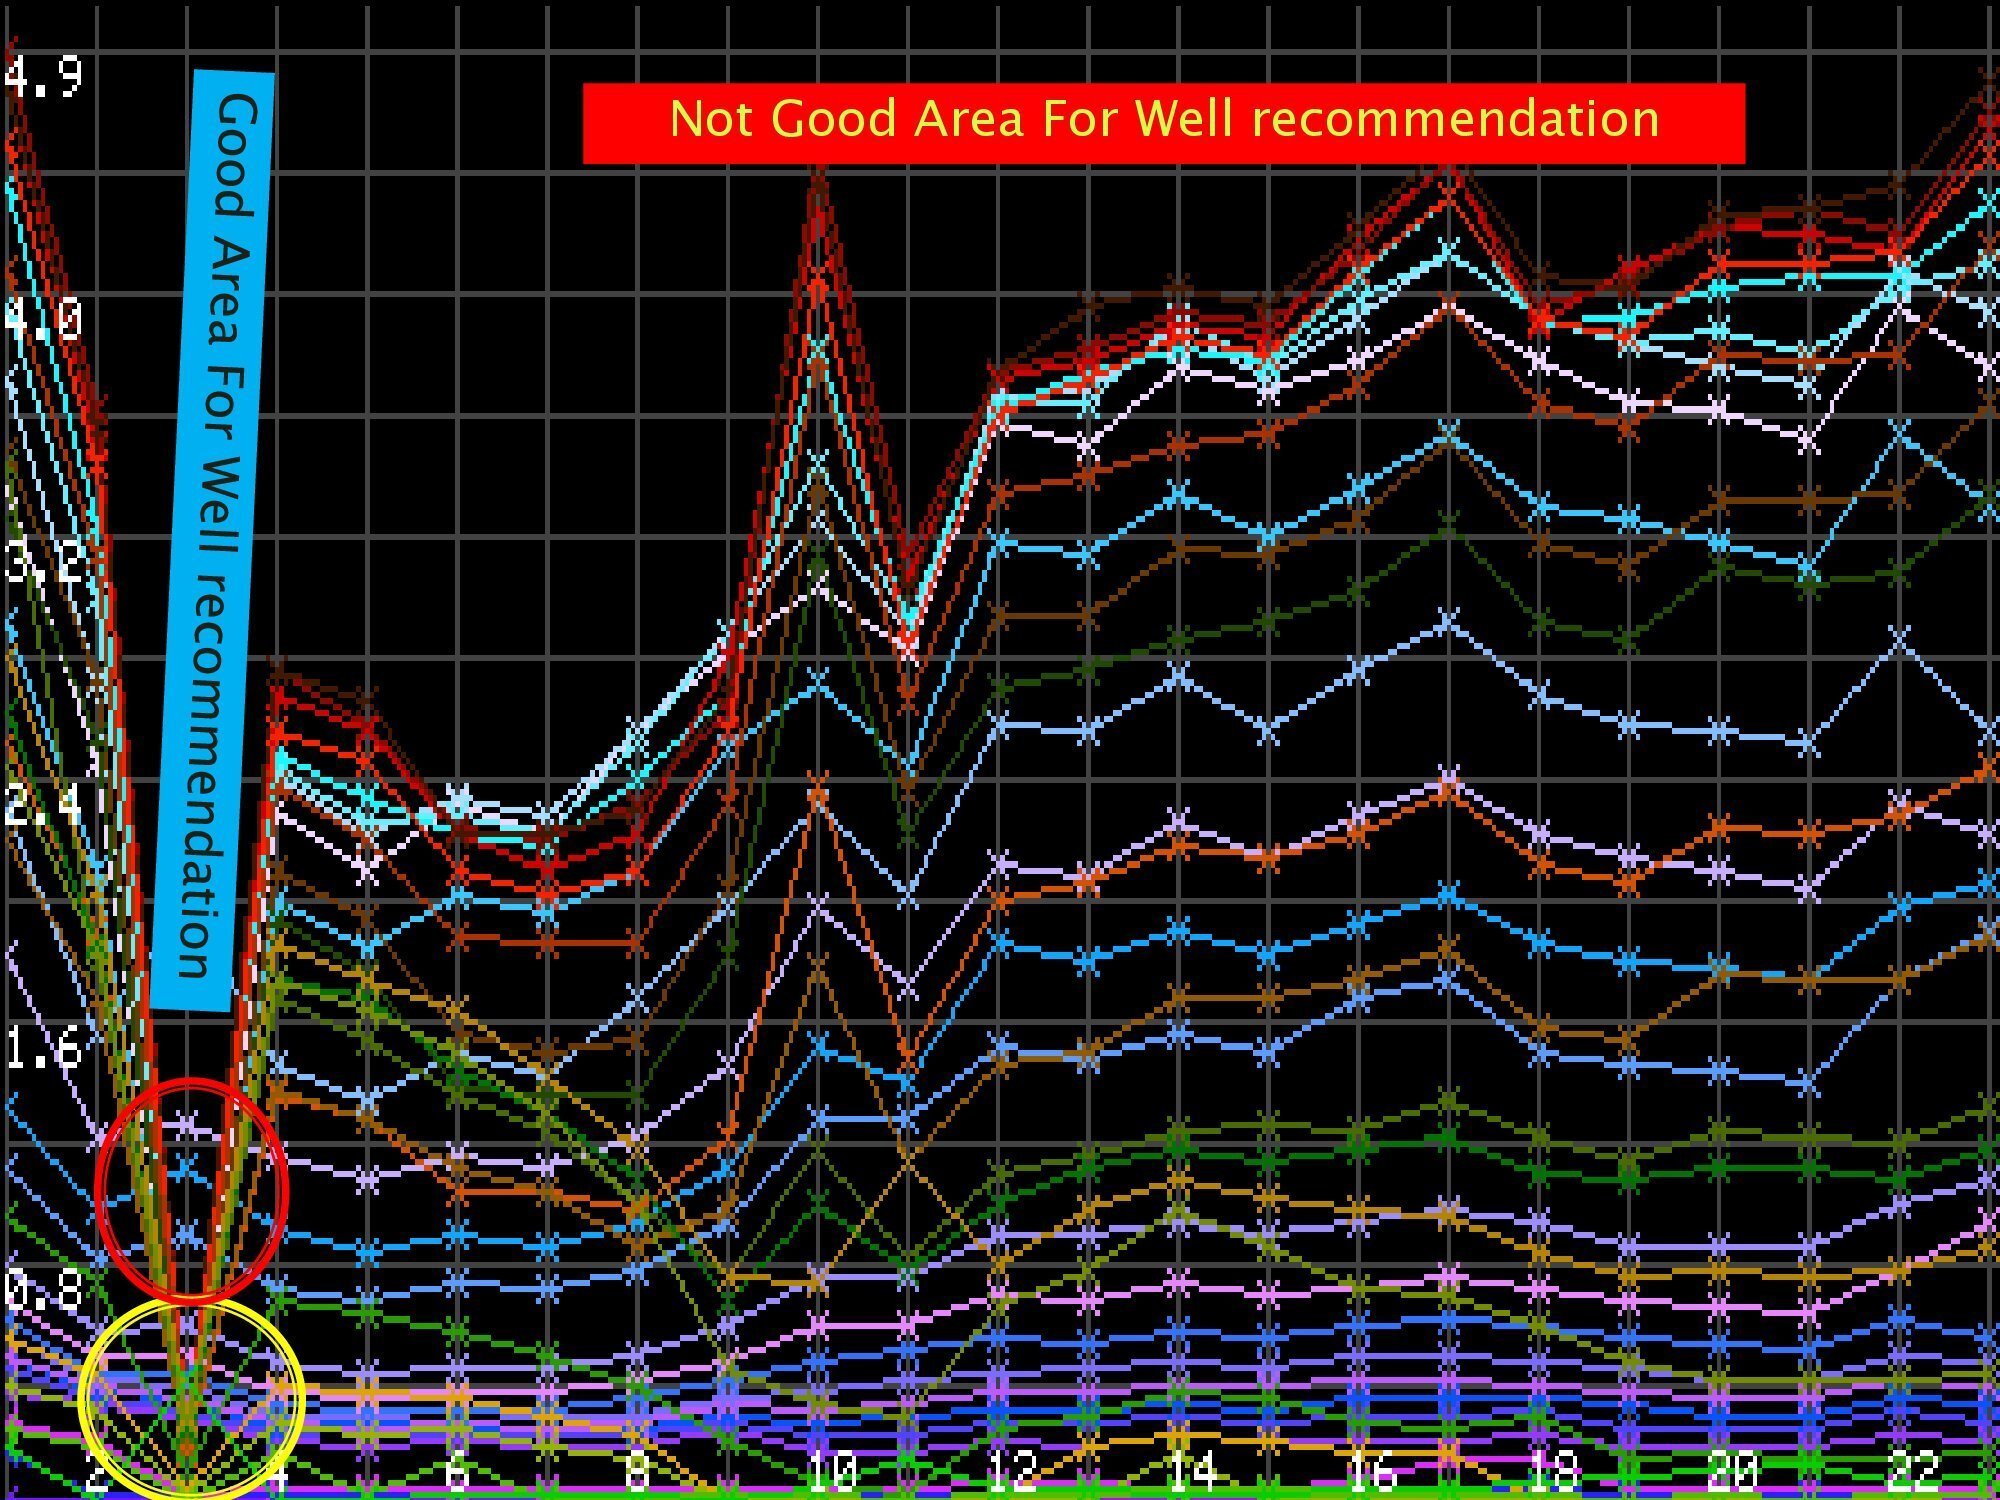
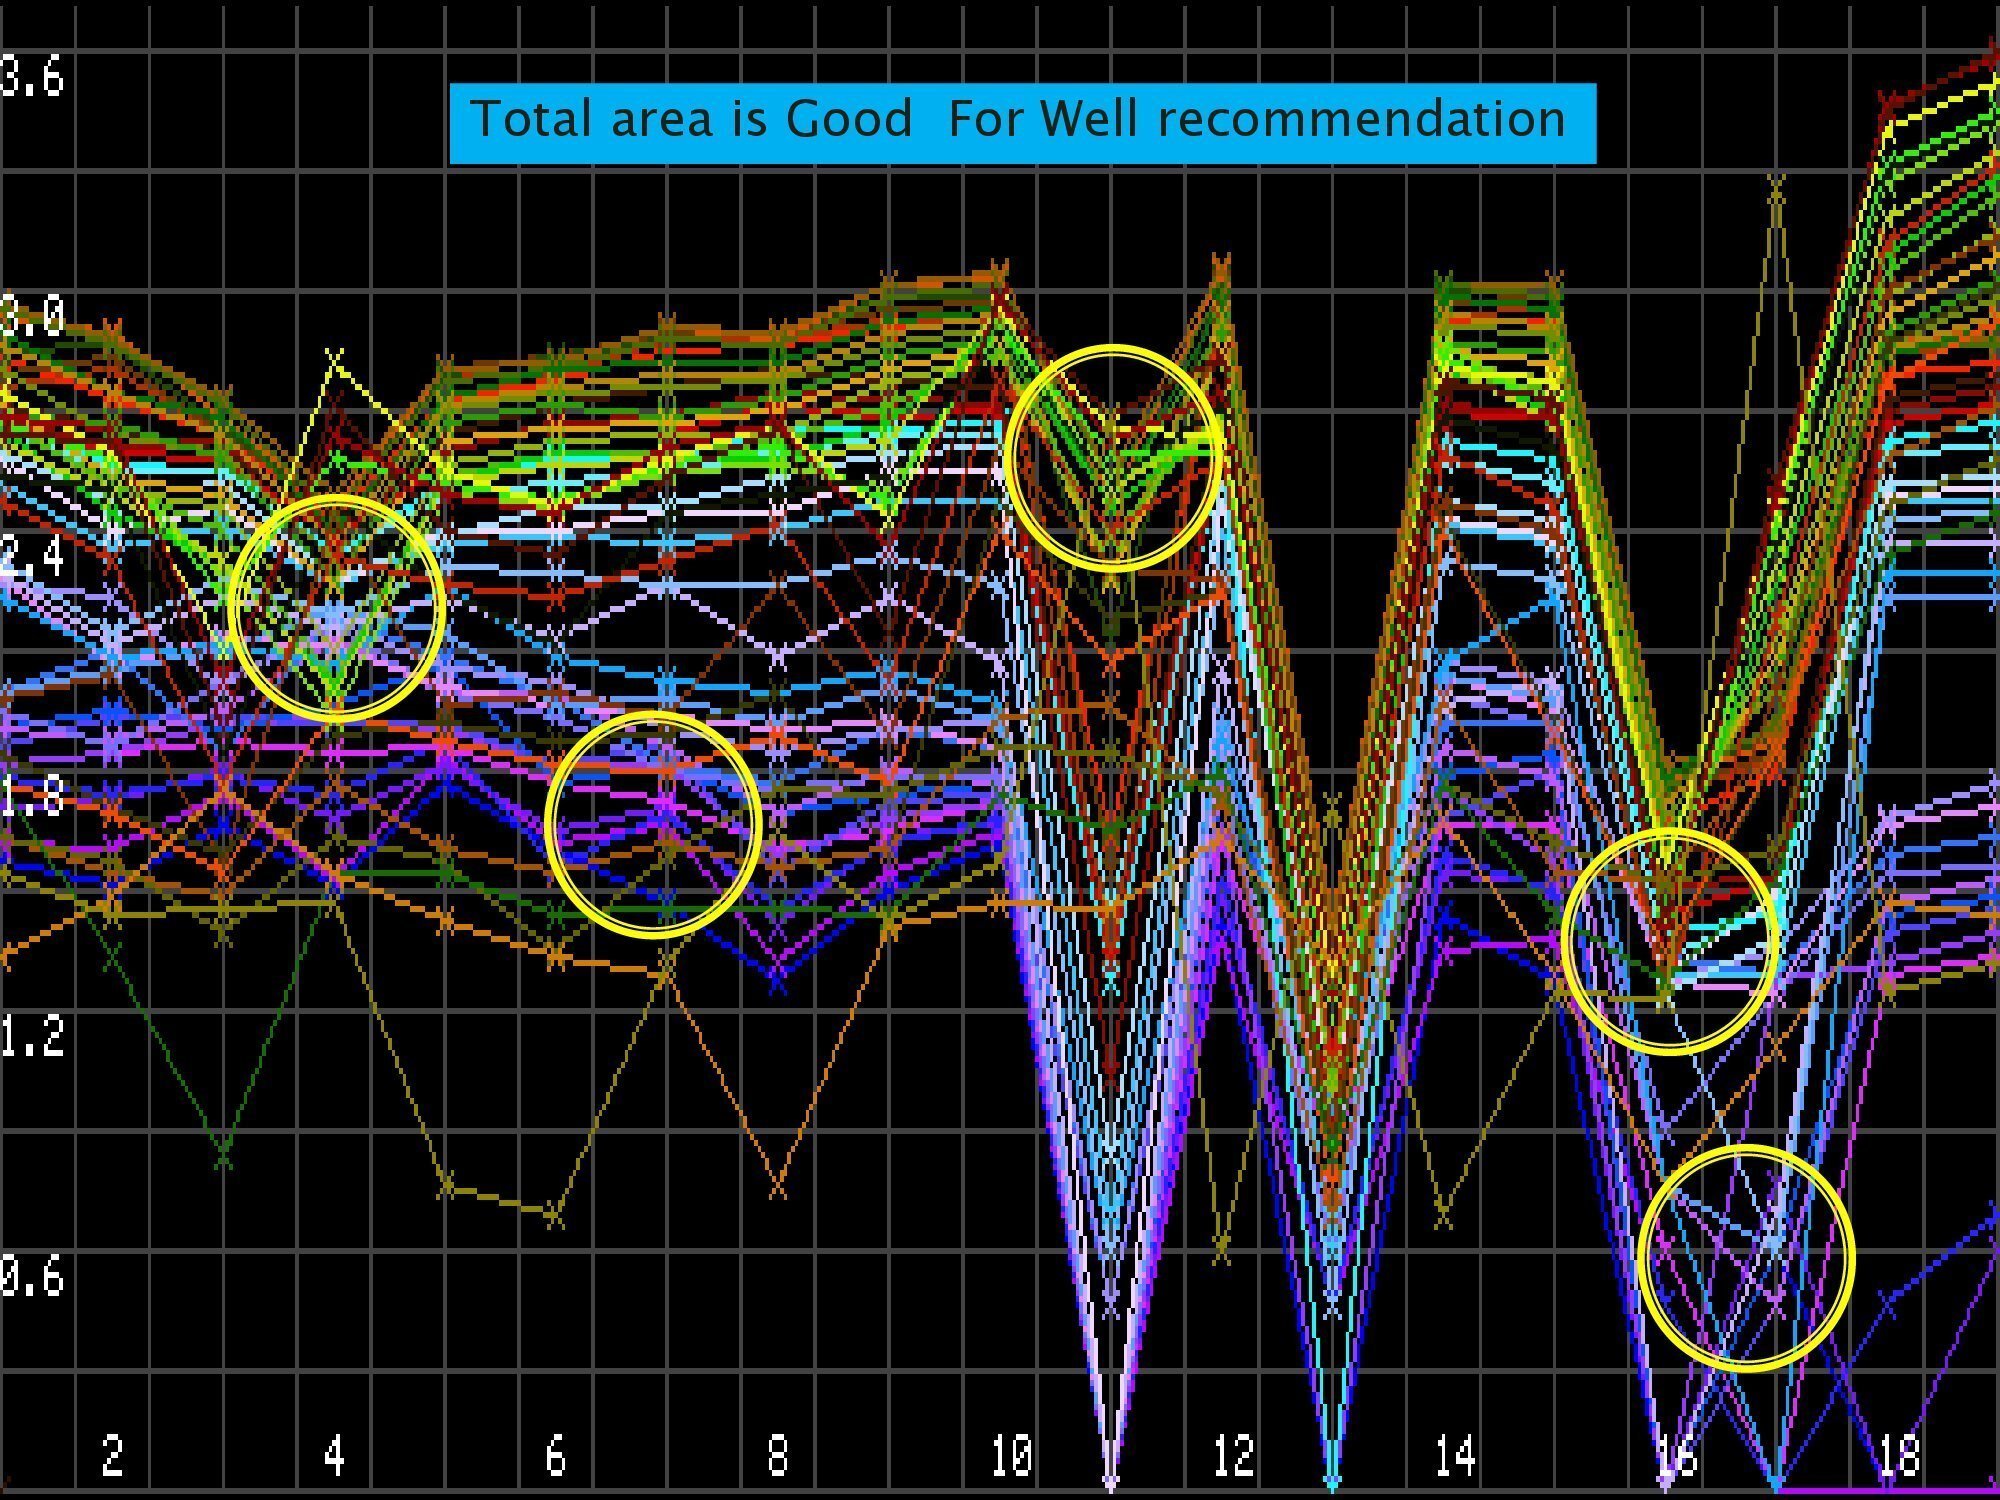
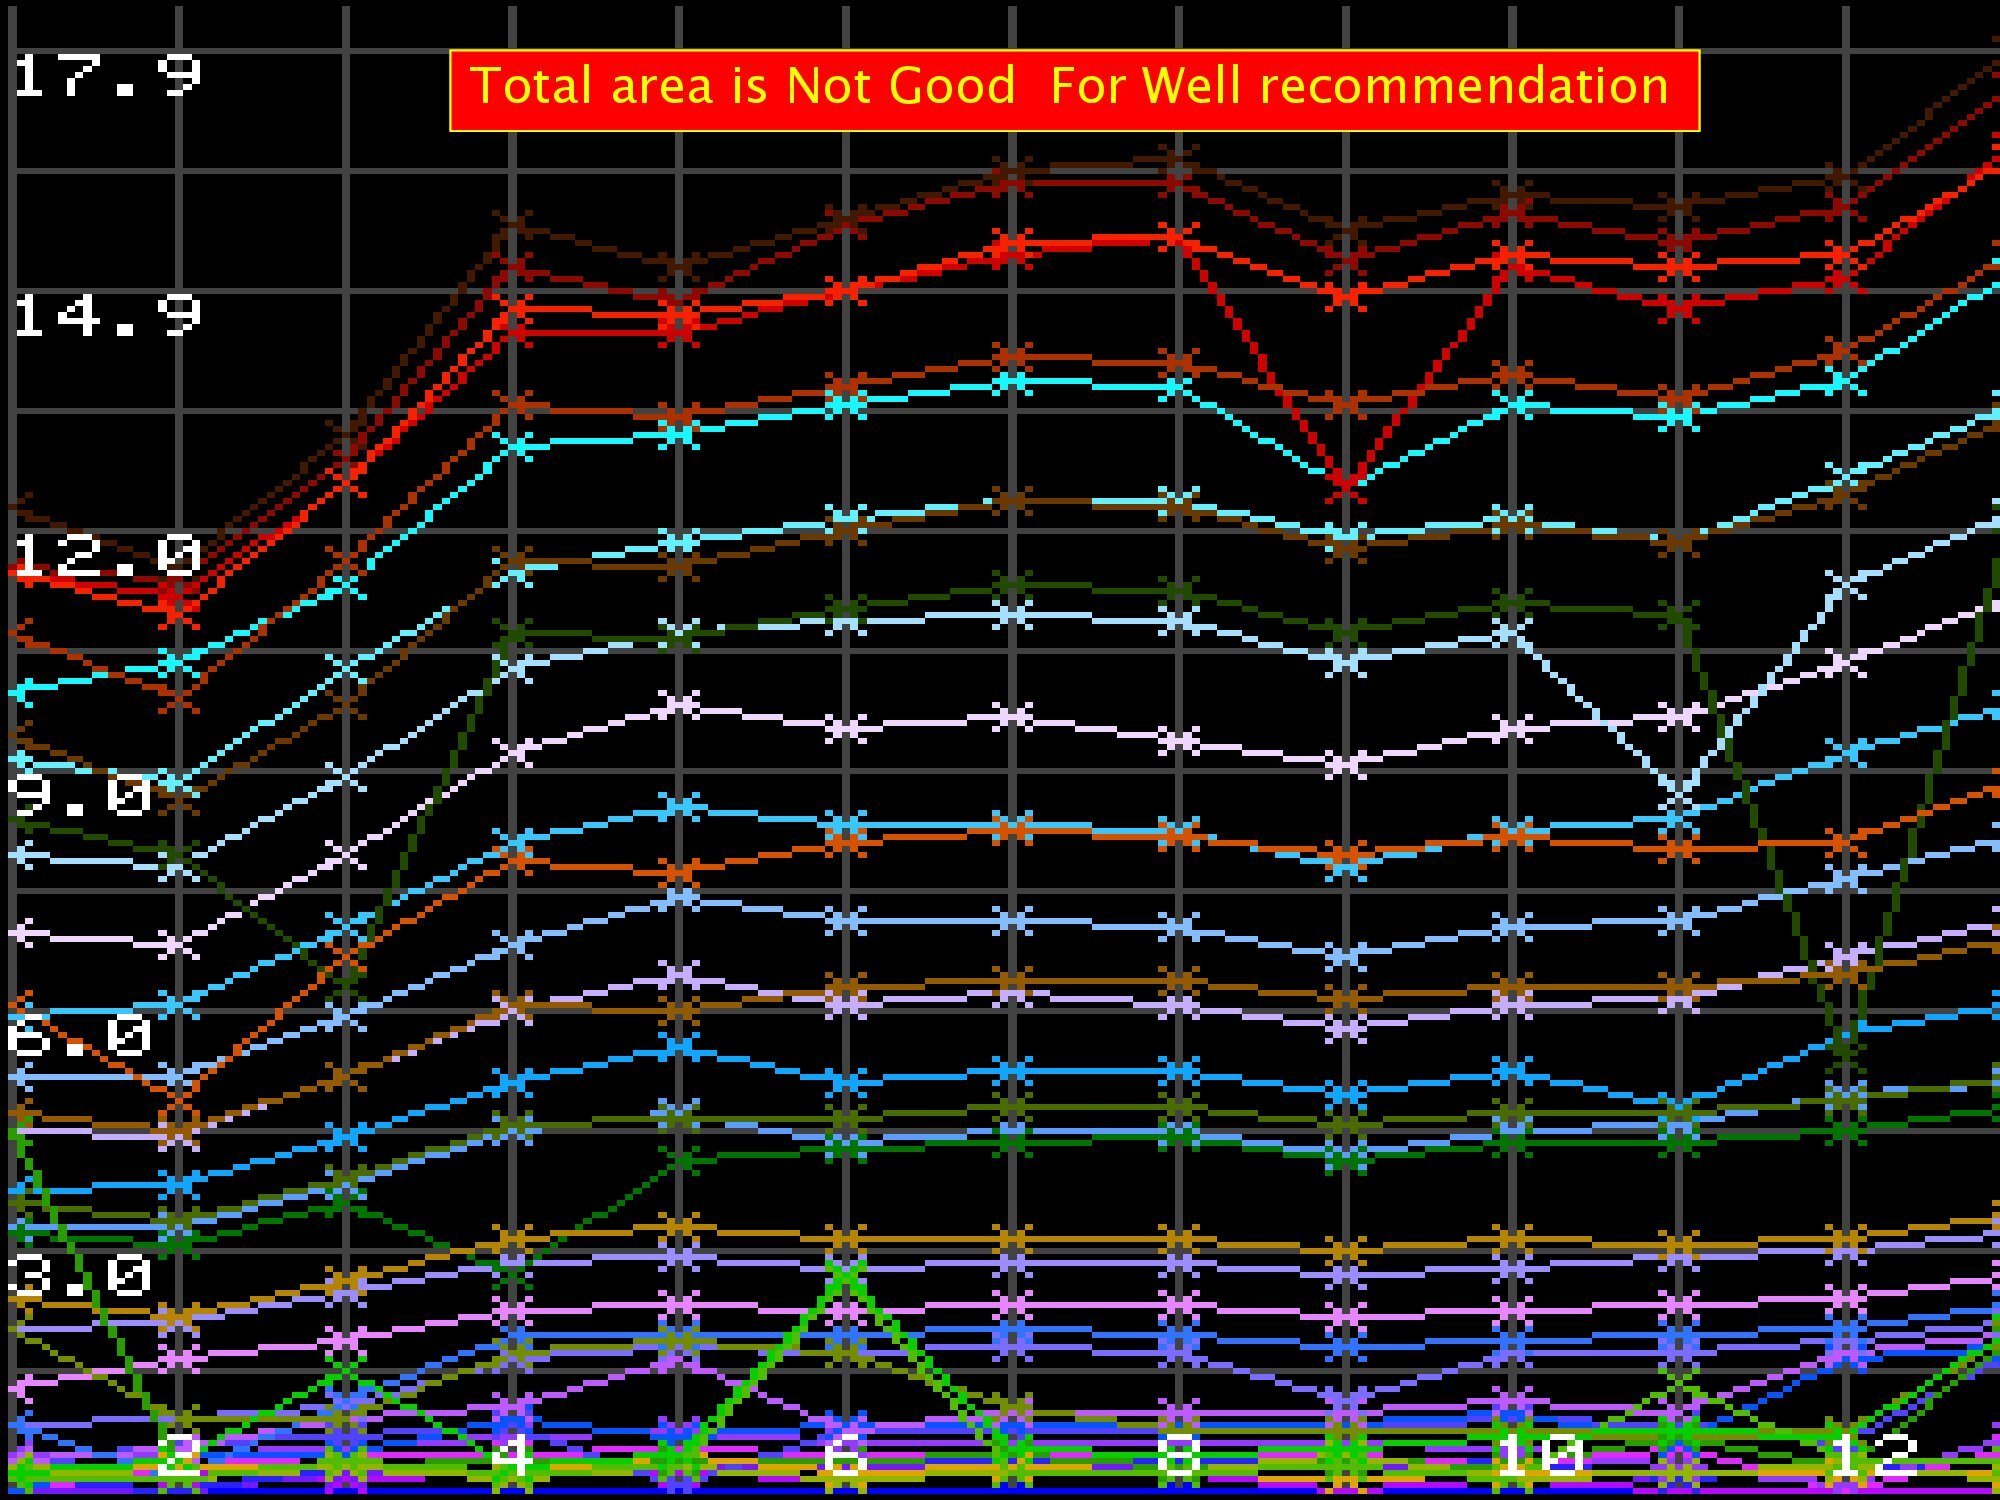
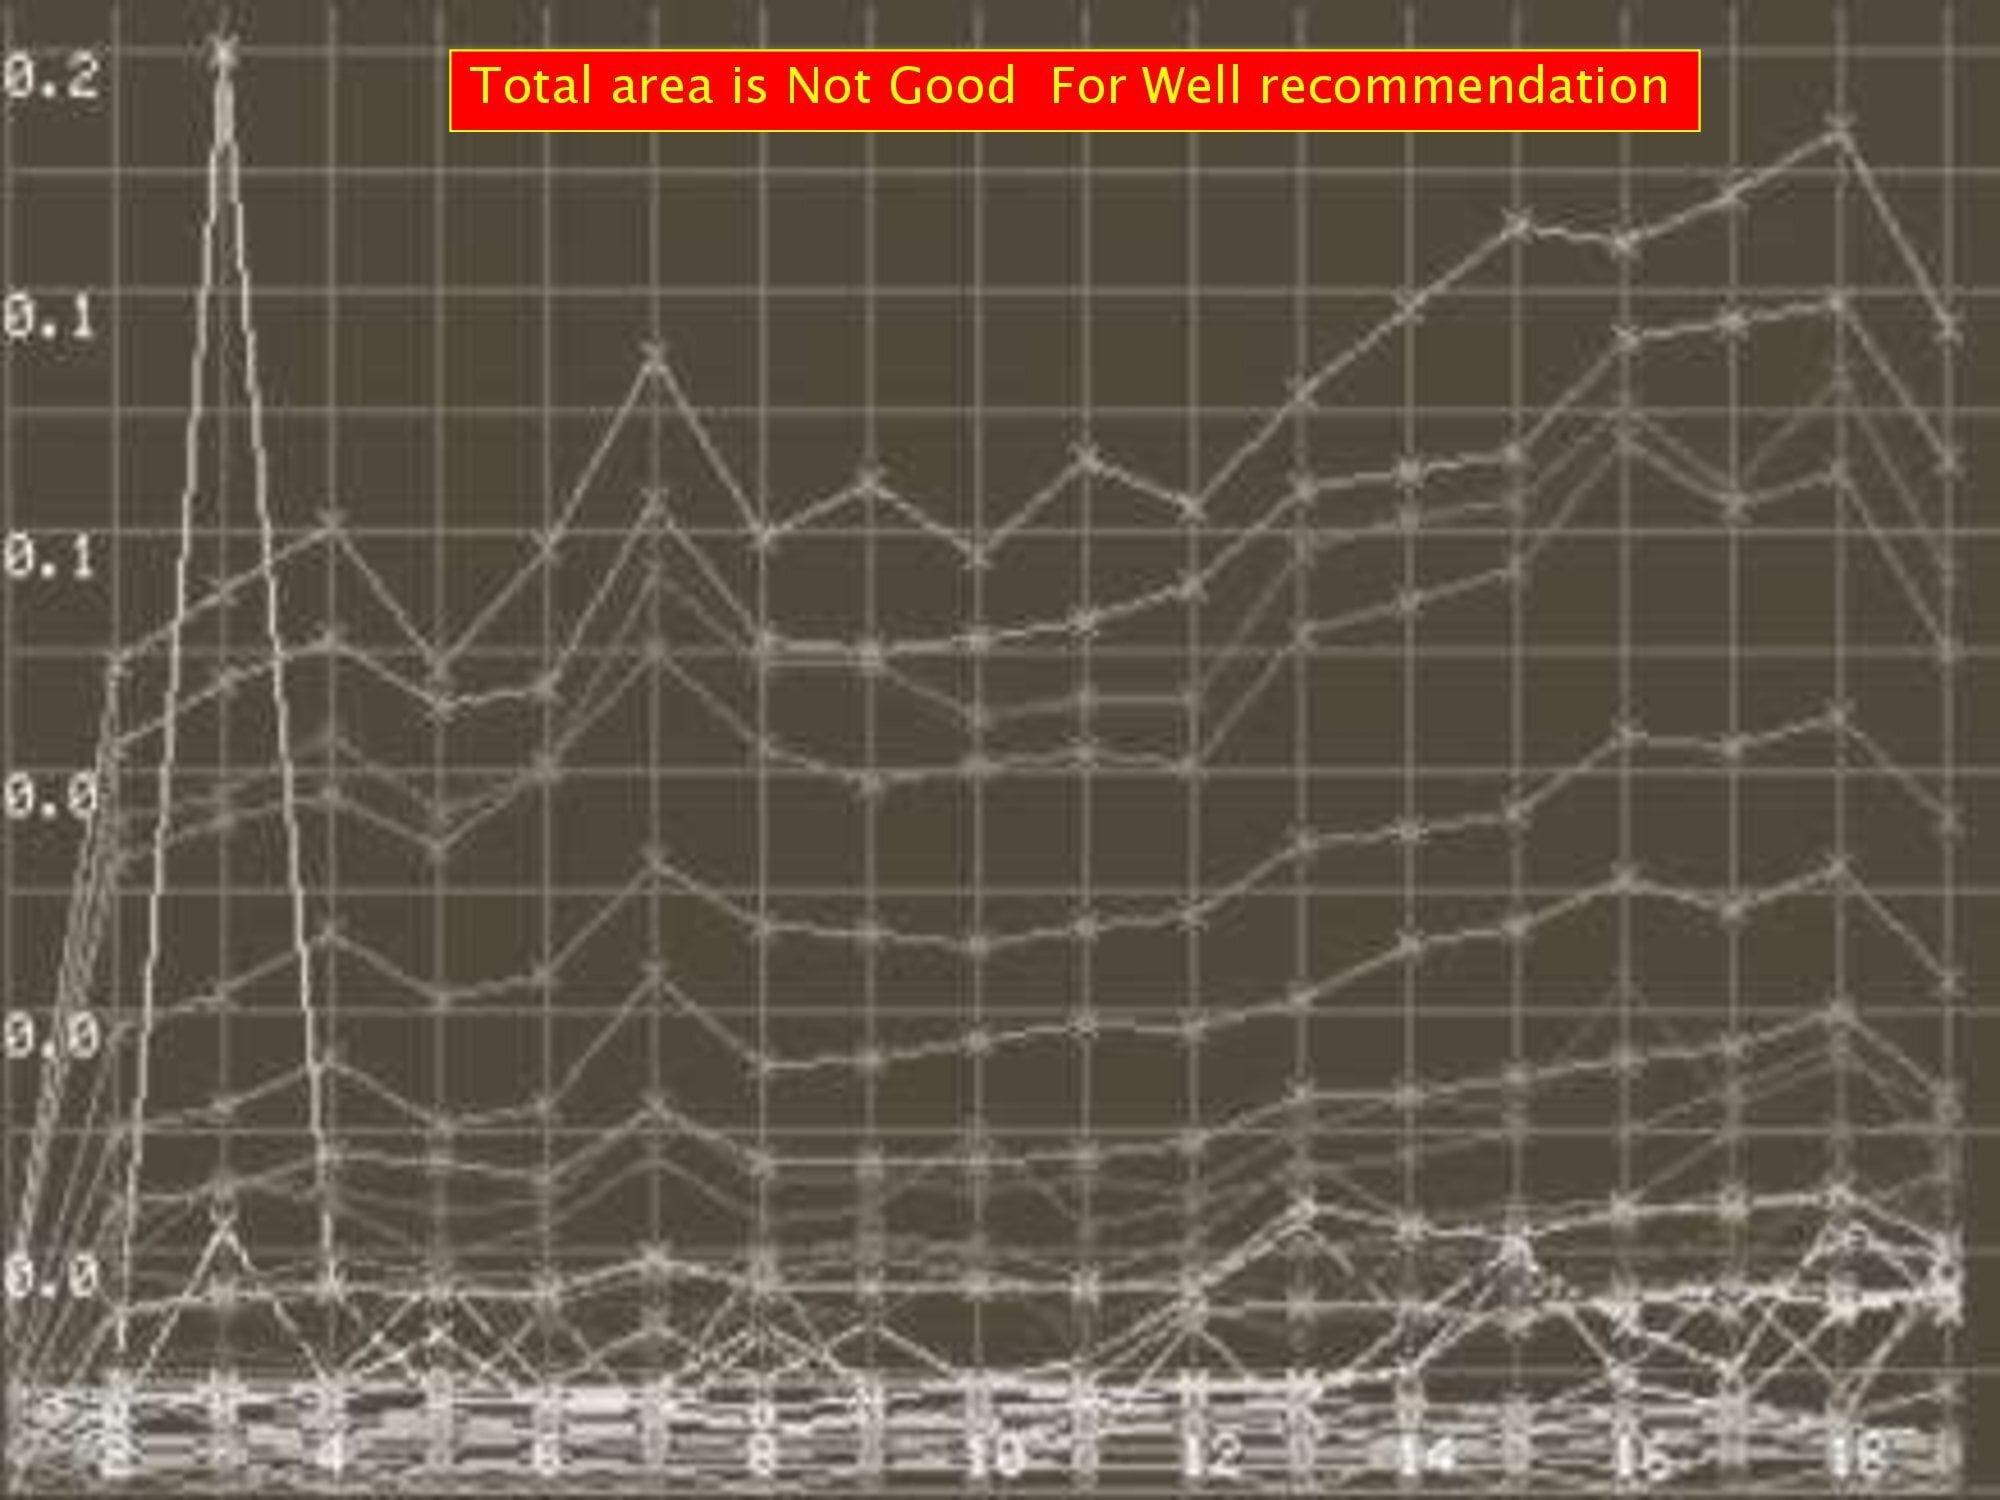
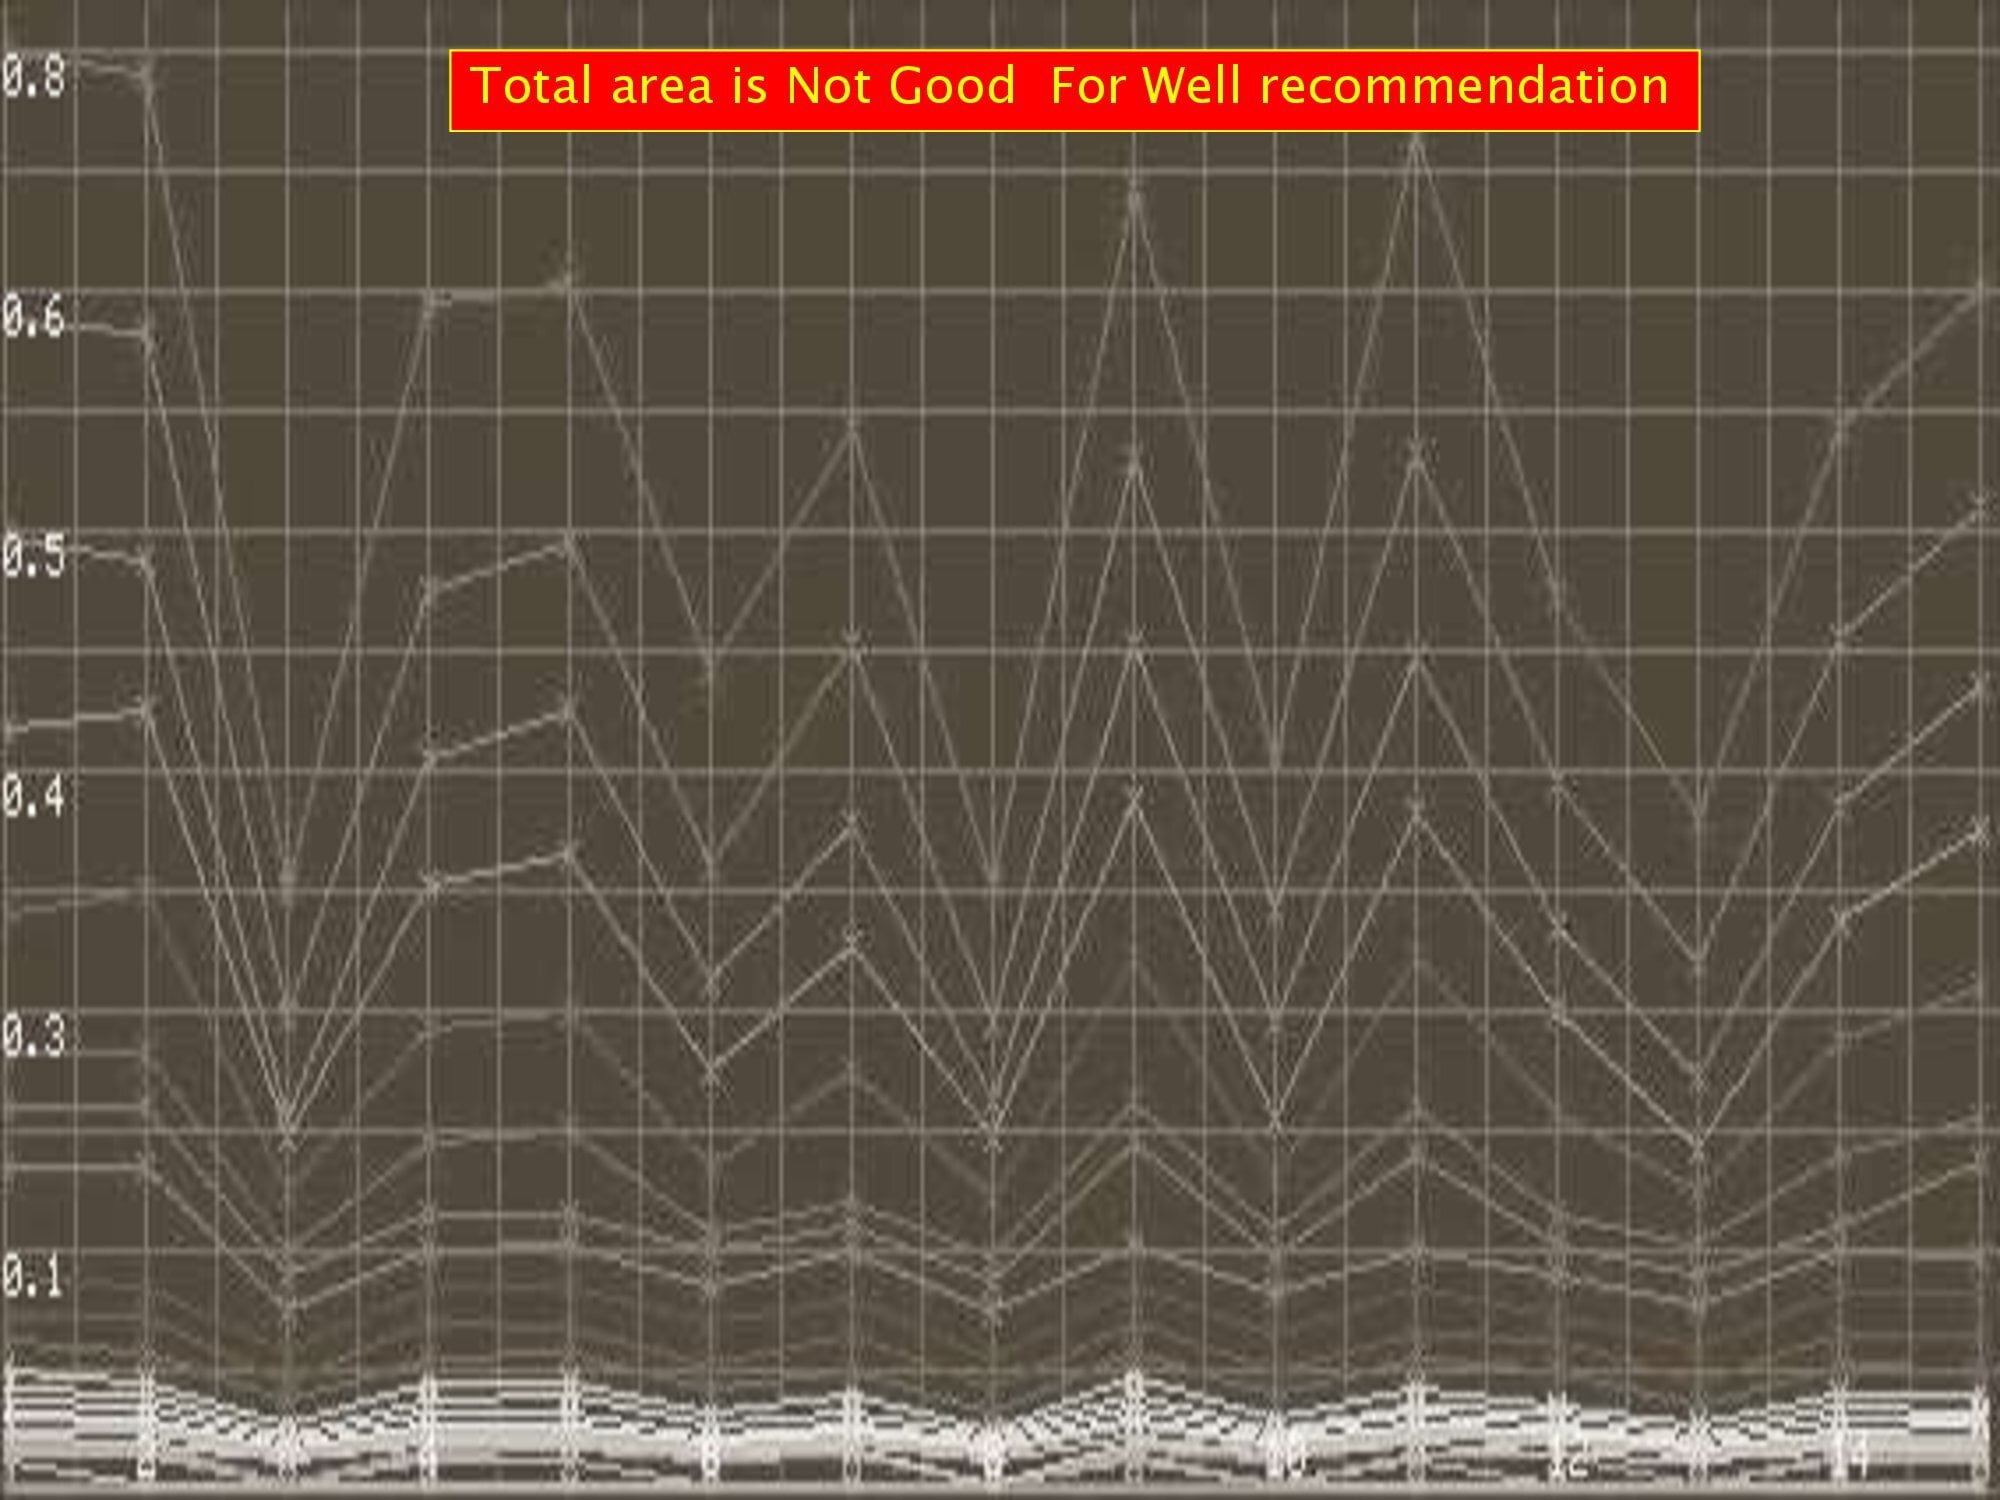
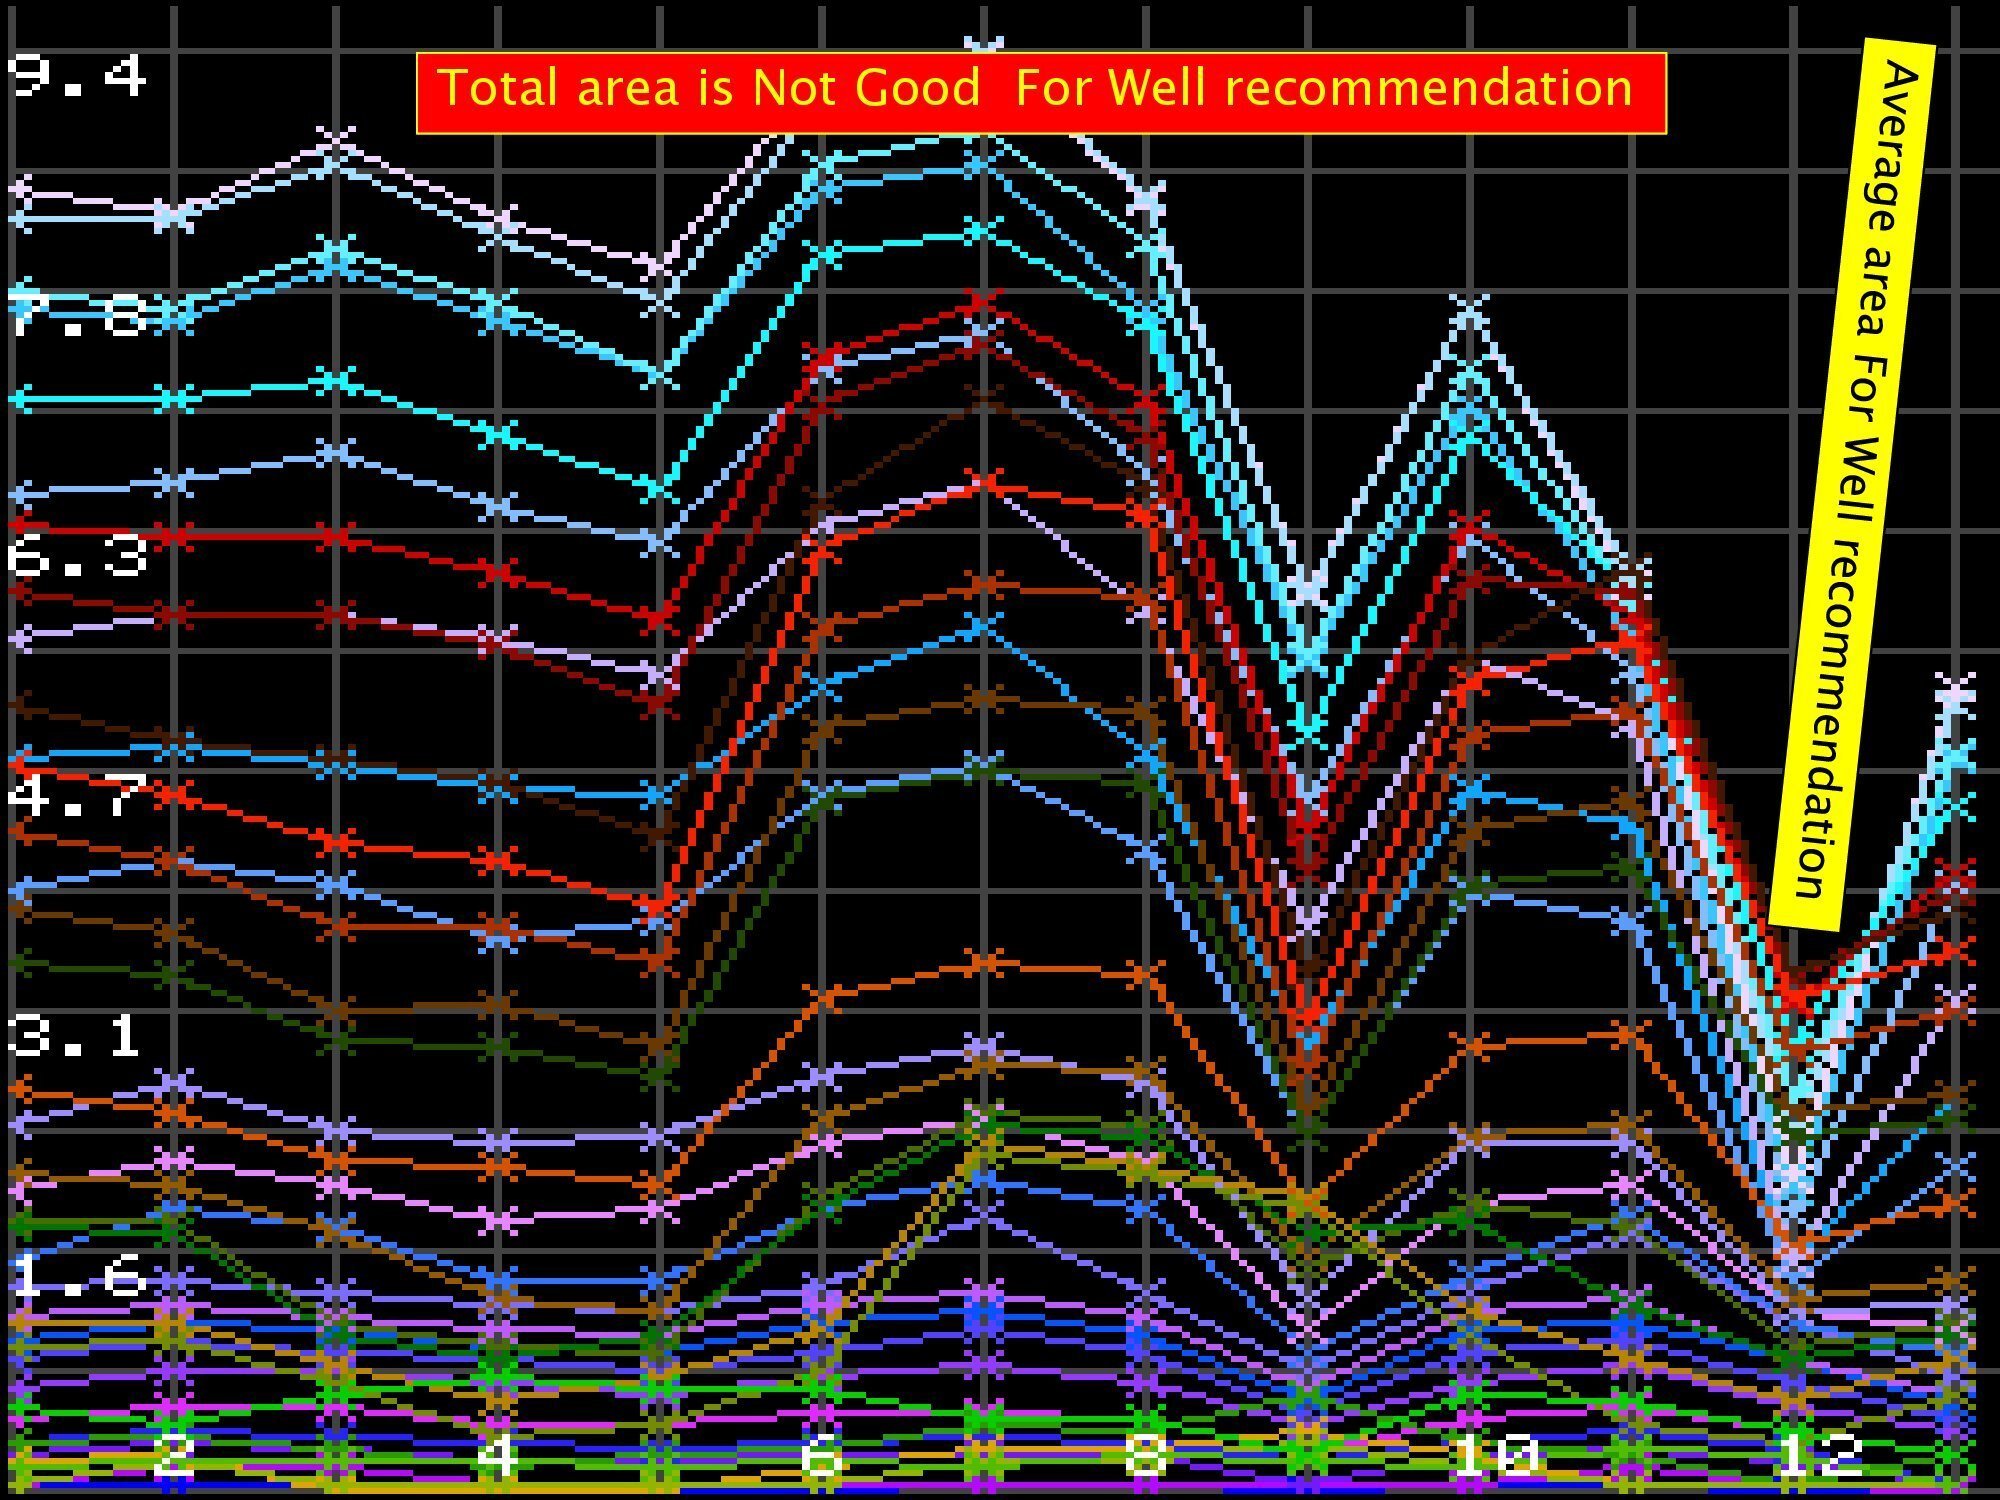
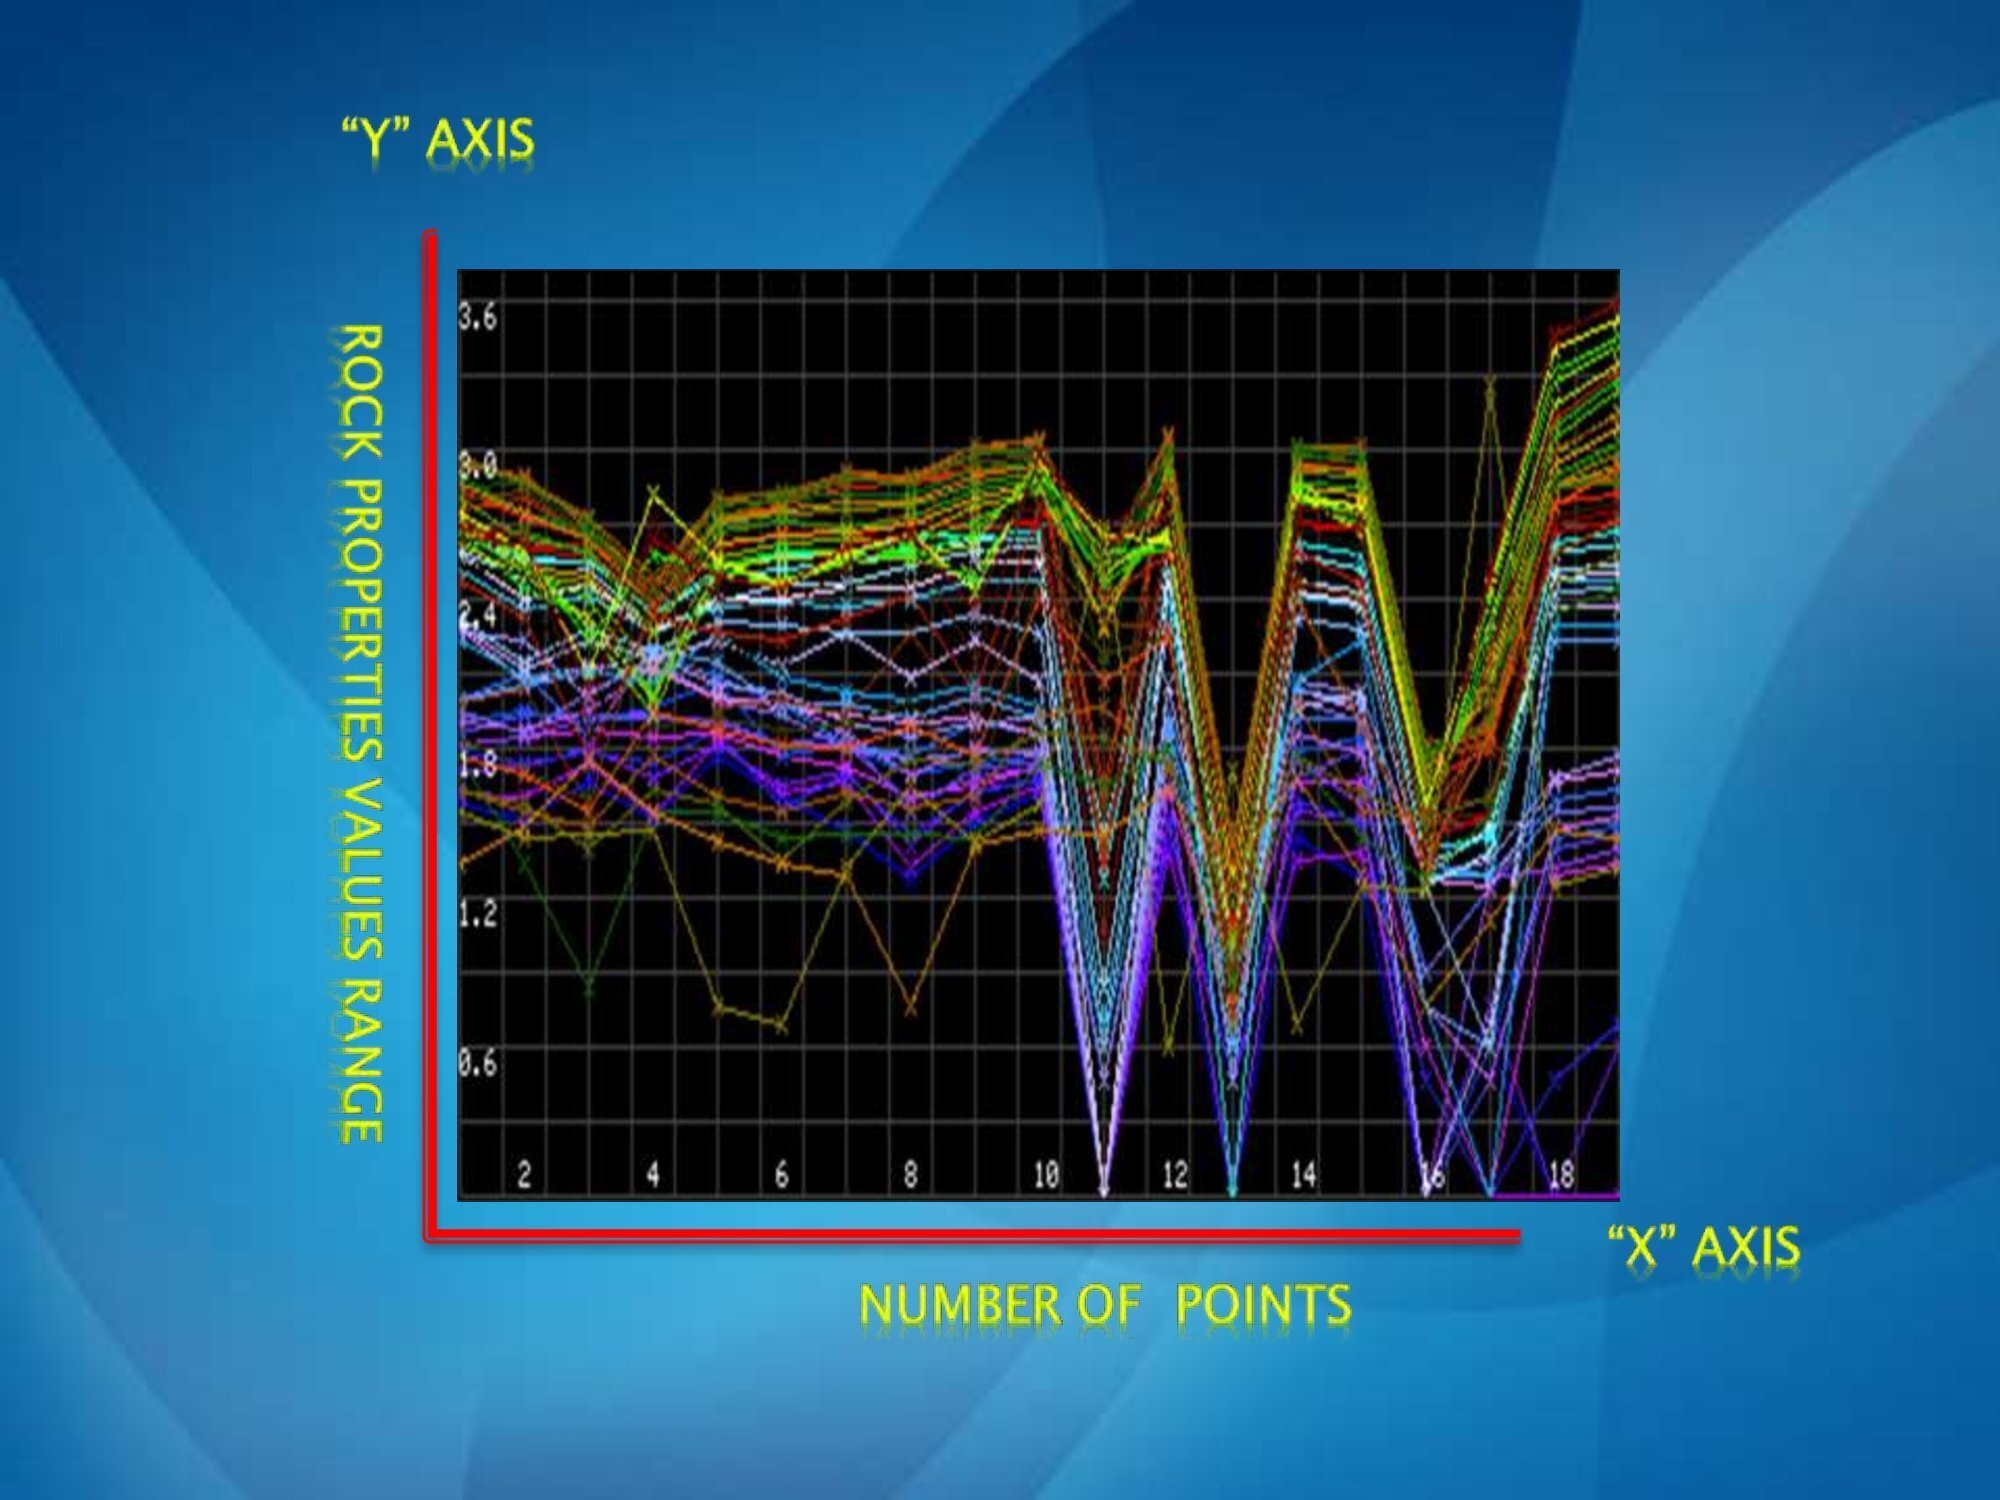
Curve Map Analysis

  • IN THE MATHEMATICS A CURVE IS GENERALLY SPEAKING AN OBJECT SIMILAR TO A LINE NOT BE STRAIGHT AND NOT TO BE ZERO
  • CURVE ANALYSIS IS POWERFUL AND EFFECTIVE ANALYSIS TECHNIQUE IN MANY RESEARCH AREAS RELATED WITH HYDROGEOLOGY
  • A LINE GRAPH IS COMMONLY USED TO DISPLAY CHANGE OVER THE AREA AND A SERIES OF DATA POINTS / LINES CONNECTED BY STRAIGHT LINE OR CURVING NATURE.
  • THE STRAIGHT/ CURVING LINE INDICATES HOMOGENEITY OF SUBSURFACE MATERIAL
  • CURVE ANGLE INDICATES THE VARIATION OF ROCK PROPERTIES
  • SUDDENLY FALL DOWN CURVE INDICATES HIGHLY CHANGED SUBSURFACE MATERIAL’S / TWO ROCKS CONTACT/MAJOR FRACTURE
  • SERIES OF STRAIGHT LINES / PARALLEL LINE ONE TO ONE INDICATES THE ROCK IS HOMOGENOUS WITHOUT ANY CHANGES 
, Analysis of Profile Map in PWQT Water Detector, Sahara Groundwater

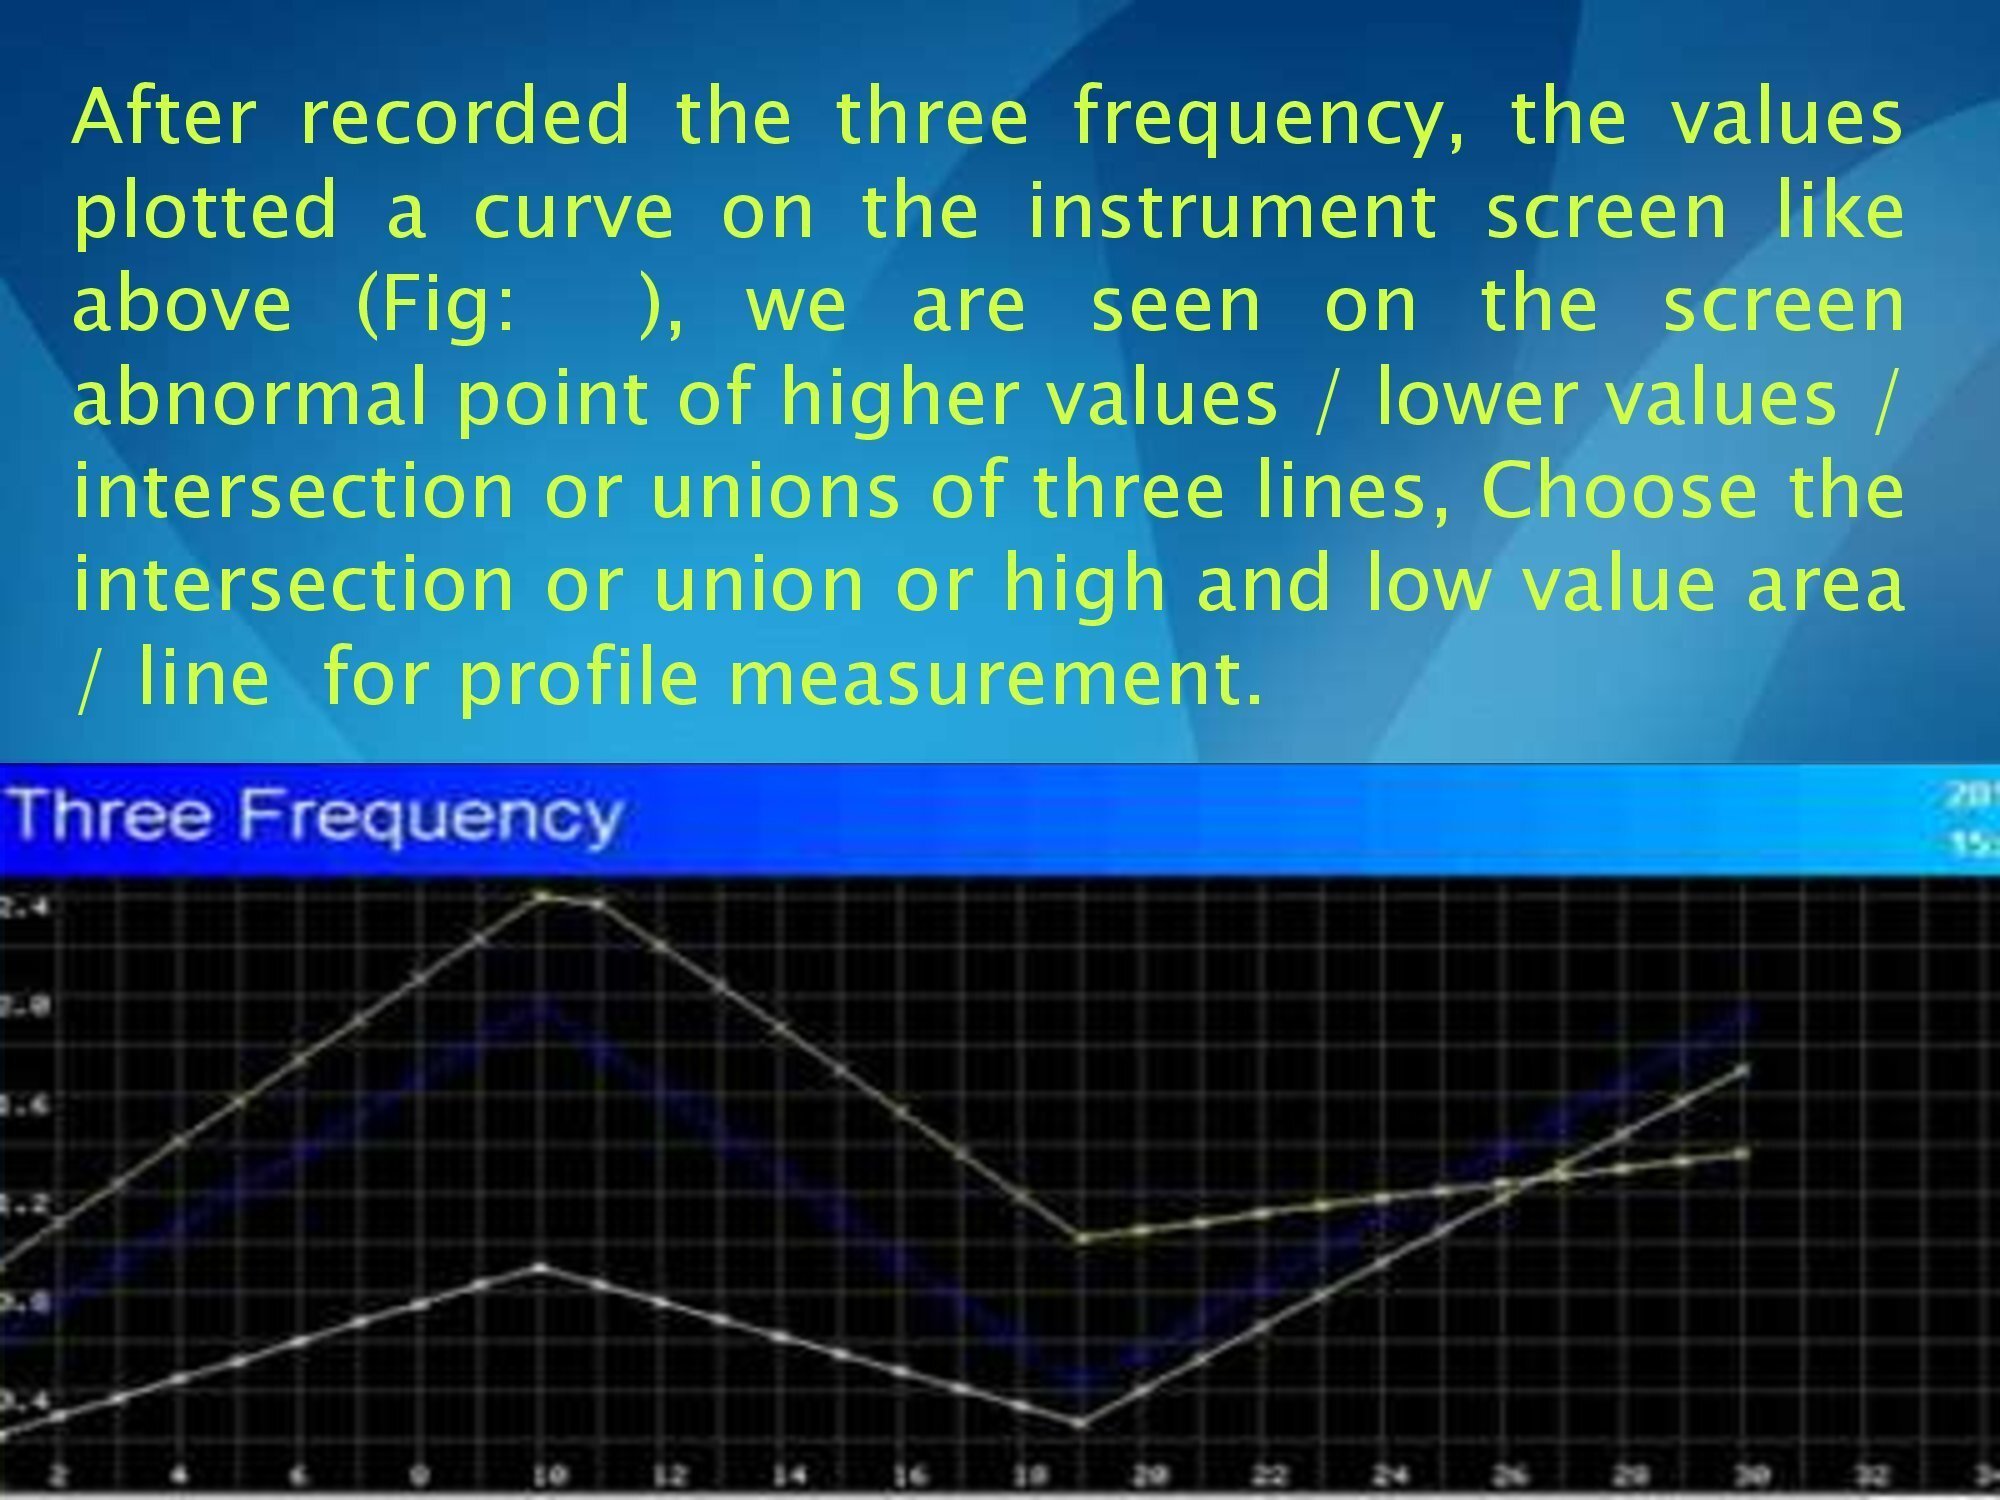
Three Frequency

, Analysis of Profile Map in PWQT Water Detector, Sahara Groundwater

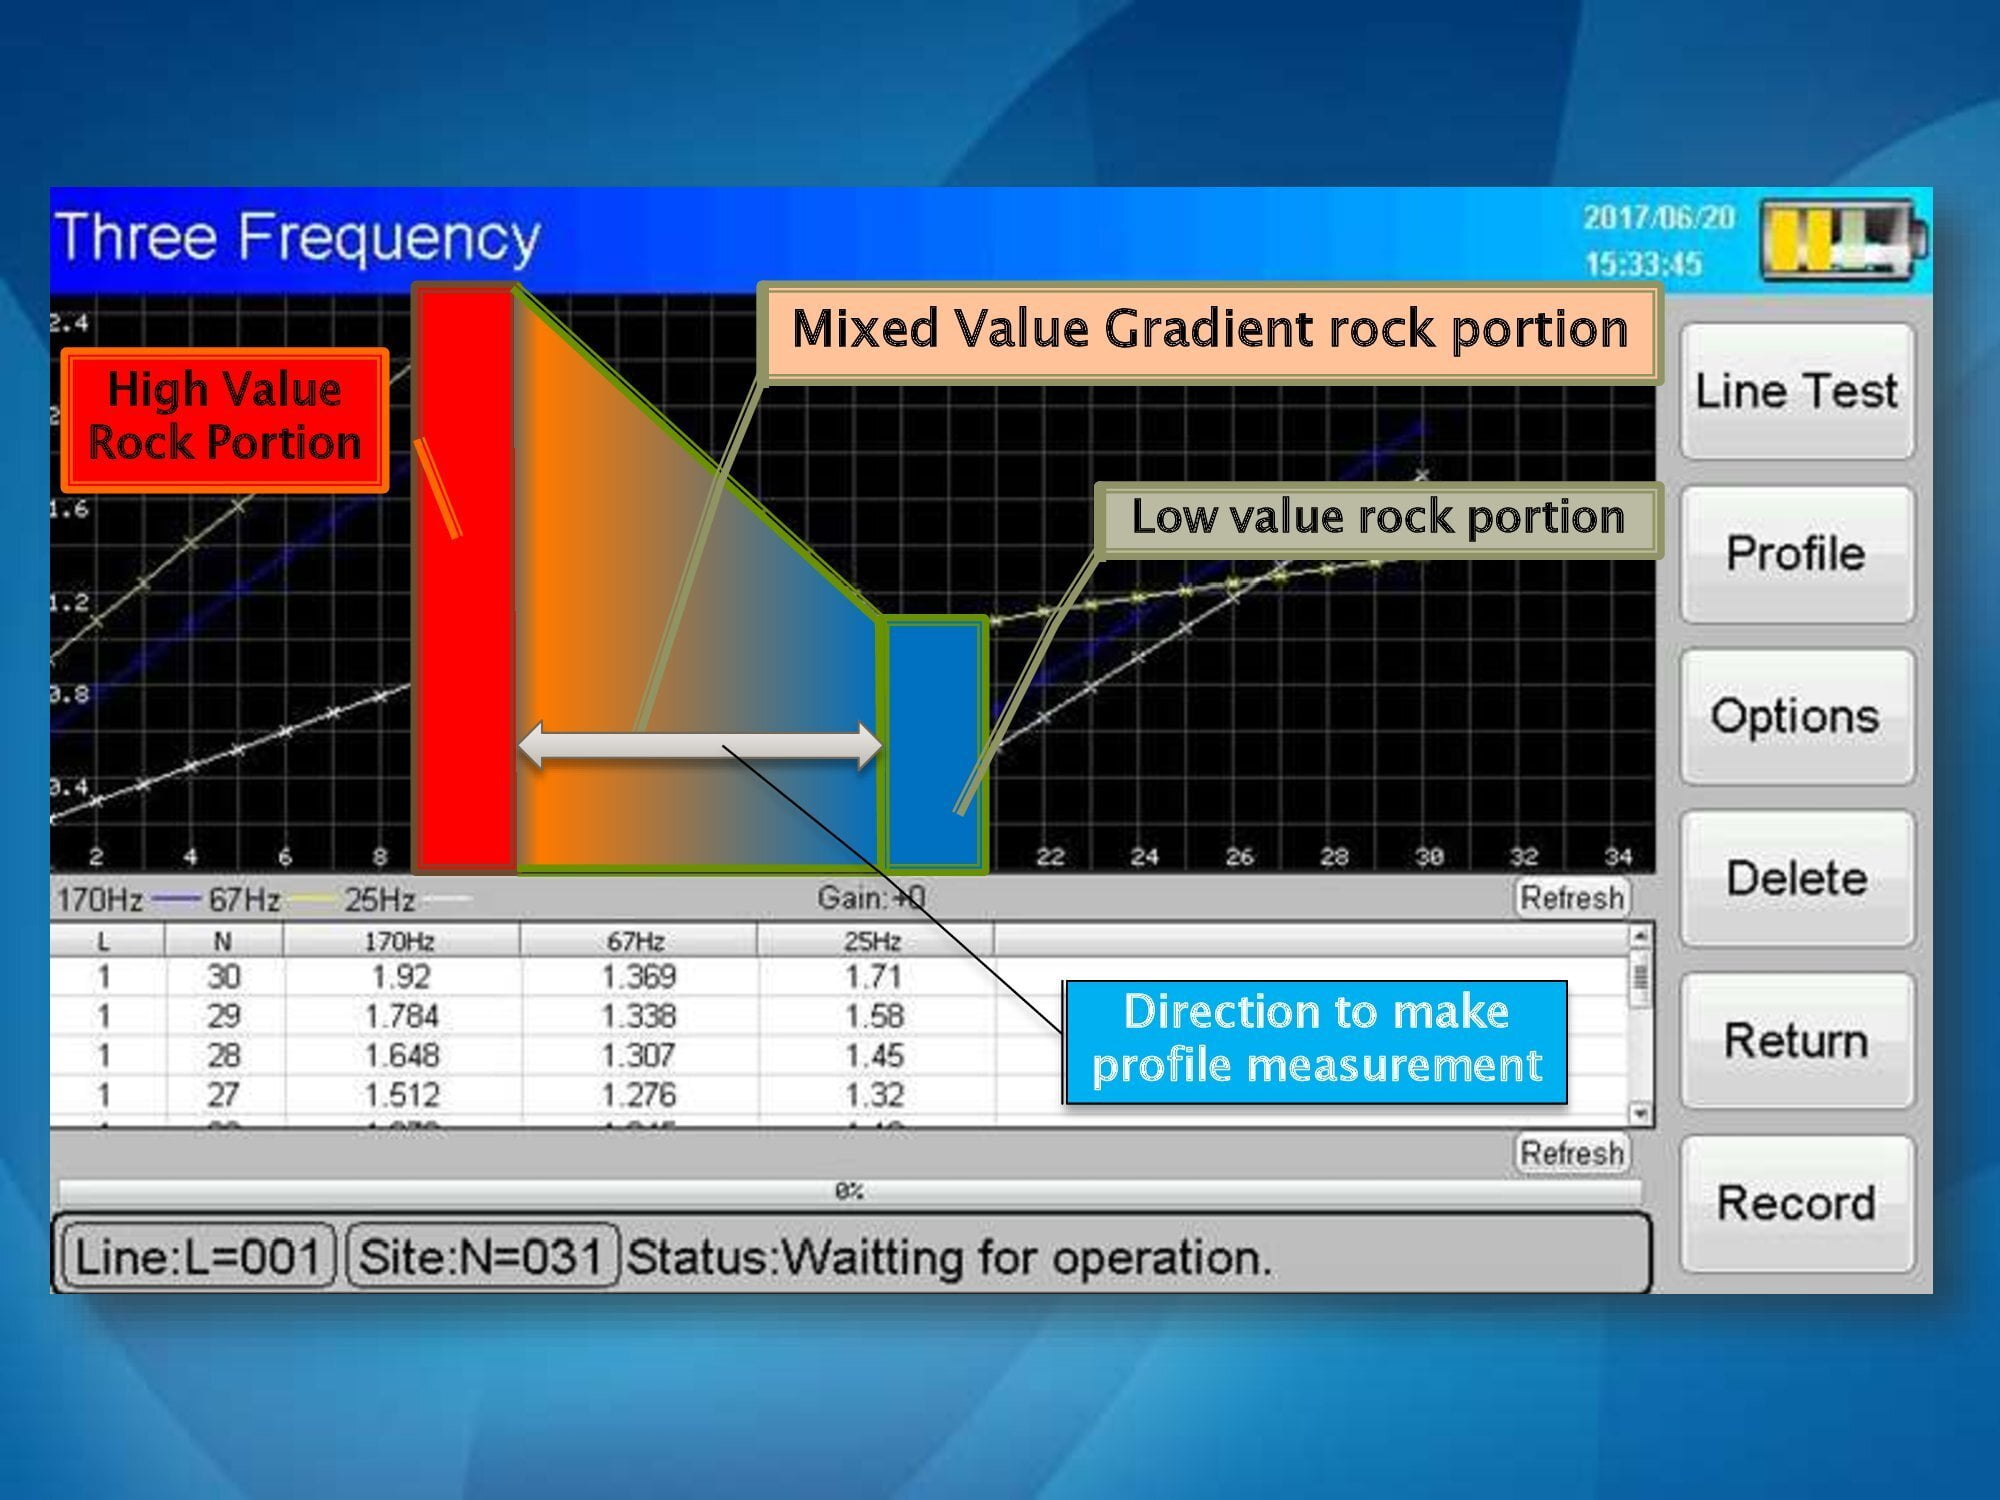
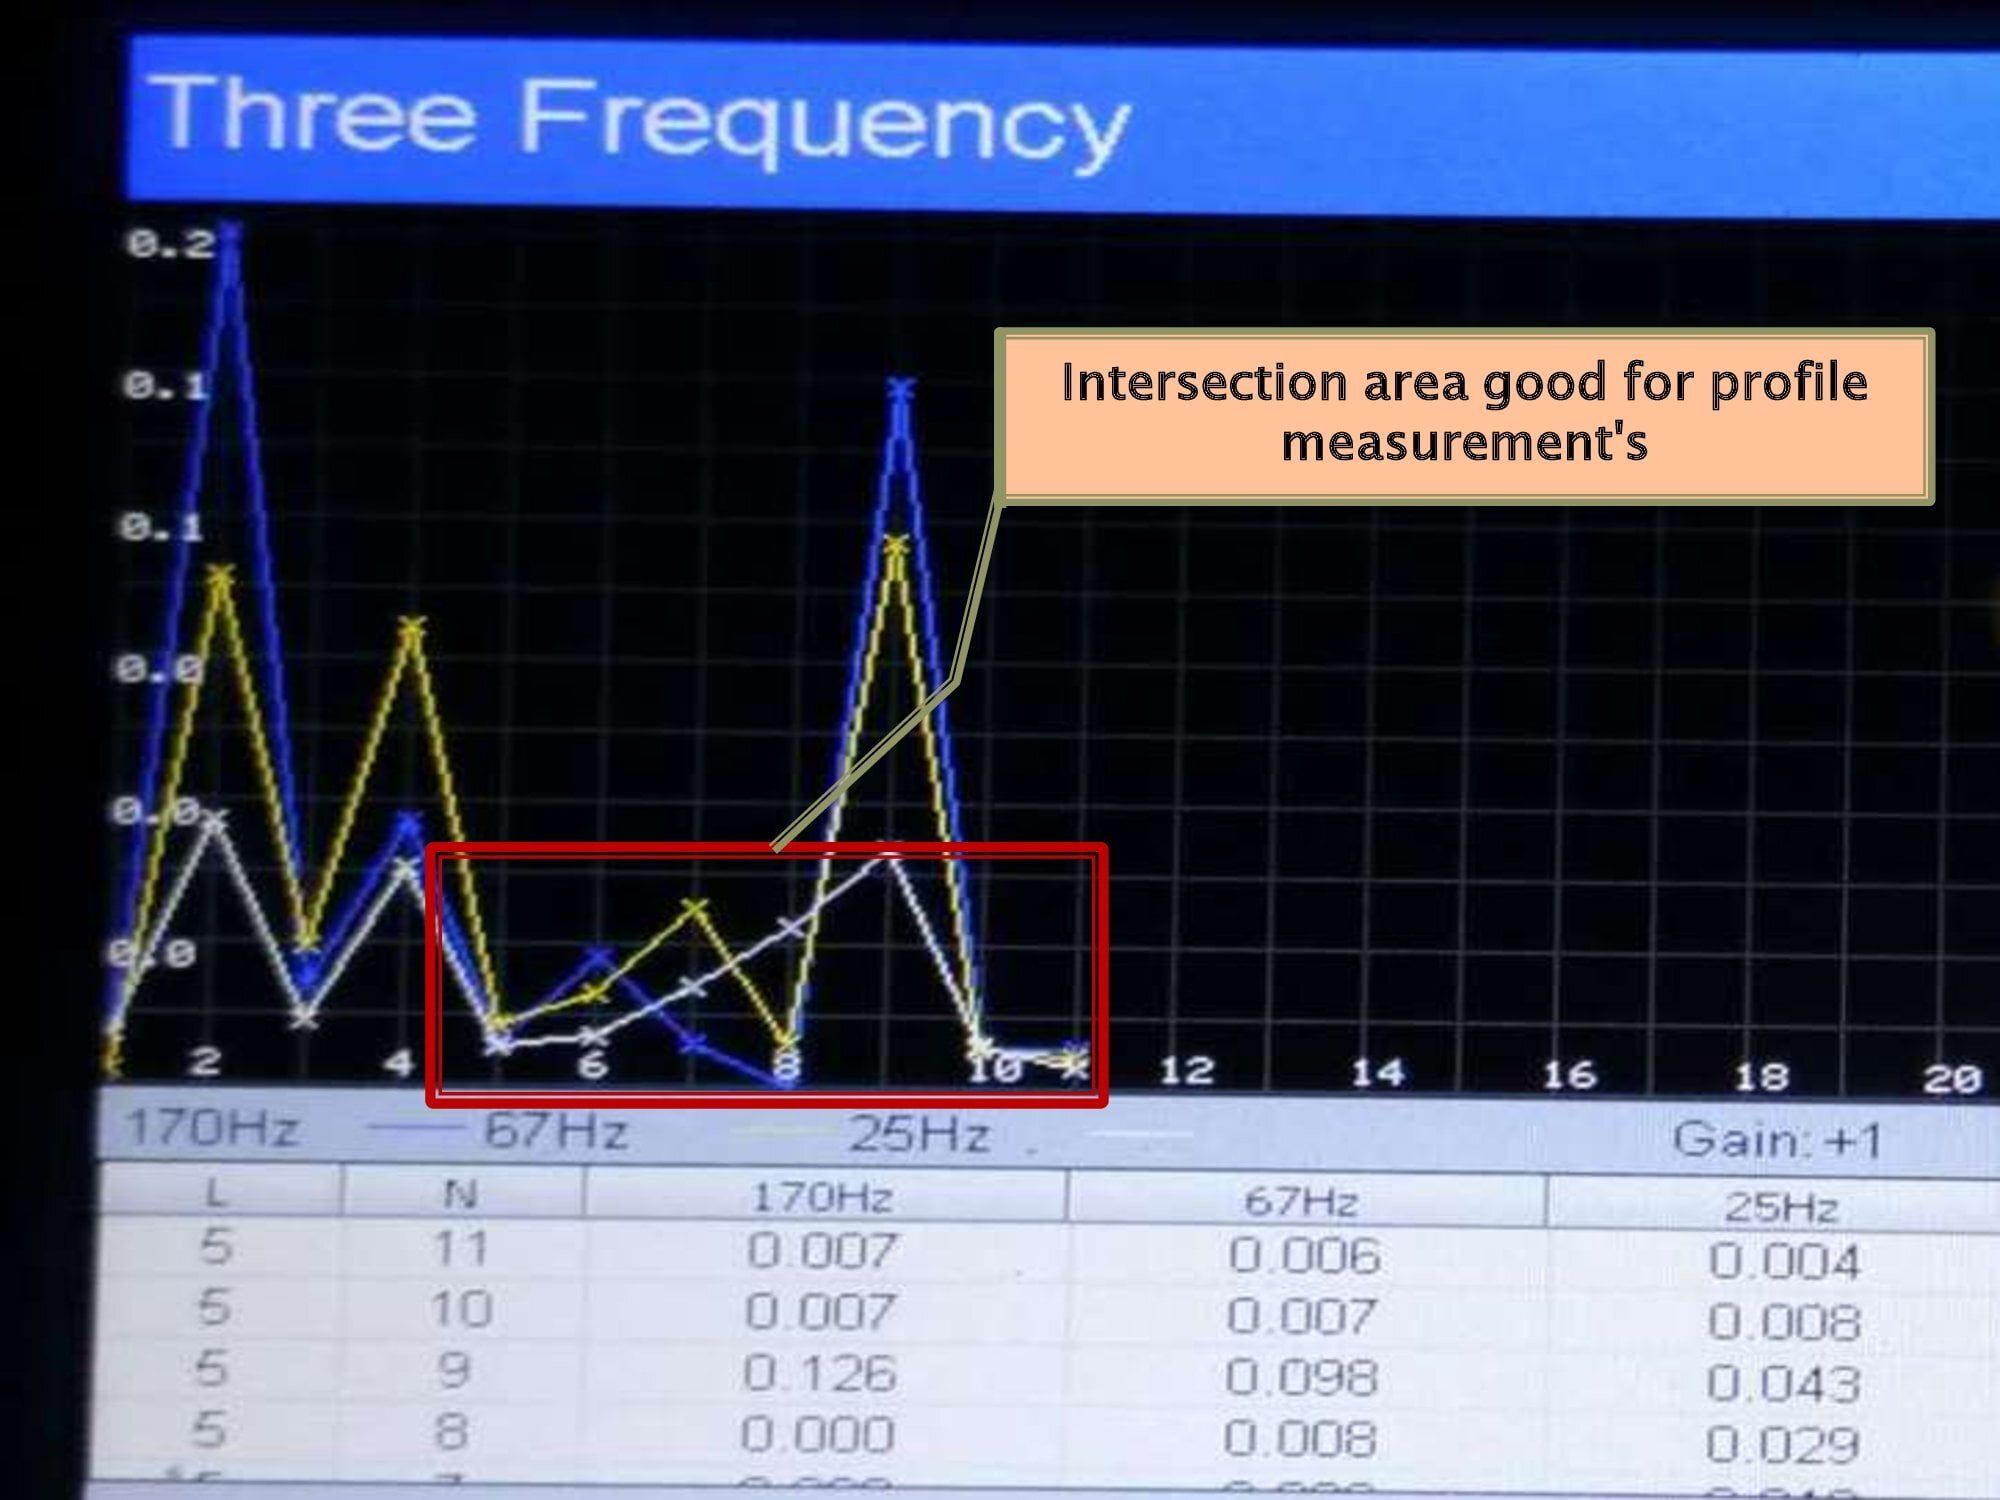
Measure the subsurface part of earth crust layers like shallow depth at 170Hz, Medium depth at 67Hz and Deeper depth at 25Hz (It is based on the maximum depth of the instrument)


Use of Three Frequency 

Shortening the area from a large area to a small area means which portion of the area is feasible / not feasible for groundwater occurrence .

Finding the direction for profile surveys like North-south / East-West etc..
, Analysis of Profile Map in PWQT Water Detector, Sahara Groundwater
Book Now ⚡
SUPPORT  70 12 05 19 37
Mon–Sat, 9:00am–6:00pm IST
Home
Created with Fabric.js 1.7.22
Book Now⚡
document-check-filled
Get Report
Support
Cart Overview